- Products ProductsLocation Services
Solve complex location problems from geofencing to custom routing
PlatformCloud environments for location-centric solution development, data exchange and visualization
Tracking & PositioningFast and accurate tracking and positioning of people and devices, indoors or outdoors
APIs & SDKsEasy to use, scaleable and flexible tools to get going quickly
Developer EcosystemsAccess Location Services on your favorite developer platform ecosystem
- Documentation DocumentationOverview OverviewServices ServicesApplications ApplicationsDevelopment Enablers Development EnablersContent ContentHERE Studio HERE StudioHERE Workspace HERE WorkspaceHERE Marketplace HERE MarketplacePlatform Foundation and Policy Documents Platform Foundation and Policy Documents
- Pricing
- Resources ResourcesTutorials TutorialsExamples ExamplesBlog & Release Announcements Blog & Release AnnouncementsChangelog ChangelogDeveloper Newsletter Developer NewsletterKnowledge Base Knowledge BaseFeature List Feature ListSupport Plans Support PlansSystem Status System StatusLocation Services Coverage Information Location Services Coverage InformationSample Map Data for Students Sample Map Data for Students
- Help
Introduction
The Data Inspector addresses developers, data scientists, and business analysts. Inspecting data on the HERE platform – structurally as well as visually – can help you understand the data’s value for your use case or can help you debug the data that you produce on the platform yourself.
The Data Inspector essentially consists of these two interfaces:
-
One that lets you programmatically create a visualization for Protobuf-encoded data by defining which elements of your data shall be presented and in what way. This interface is called a GeoJSON rendering plugin and it transforms your Protobuf-encoded data to GeoJSON.
-
The point-and-click UI that lets you interact with the data. It offers visual clues on where your data is located and how it is distributed geographically. It lets you view the data visually on a map using a GeoJSON plugin to transform the data and a GeoJSON rendering engine to visualize it. In case the data is already formatted as GeoJSON, it renders directly.
The platform lets you attach a GeoJSON plugin to your schema. So, when you share your data with someone, the schema and the plugin are implicitly shared with it. This way, they can benefit from the visualization that you've created. In fact, a number of platform data sets already have a schema and plugin attached so that you can enjoy automatic decoding and visualization for these data layers out of the box.
Moreover, the Data Inspector allows you to download data for a selected partition for further analysis in these formats:
- Raw (binary) data
- Data decoded with the Protobuf schema that is attached to a layer (in JSON format)
- GeoJSON data translated with the JS rendering plugin that you can immediately visualize in an external application
You can also inspect up to 4 datasets at the same time - either layers from the platform or local partitions. Not only you can inspect different layers, but also a few versions of the same layer simultaneously. You can use this functionality to visually debug your pipelines by rendering the pipeline output in the portal and having it overlaid with the input layer(s).
The Data Inspector allows visualizing the following types of data:
-
Protobuf-encoded data visualized with custom GeoJSON rendering plugins:
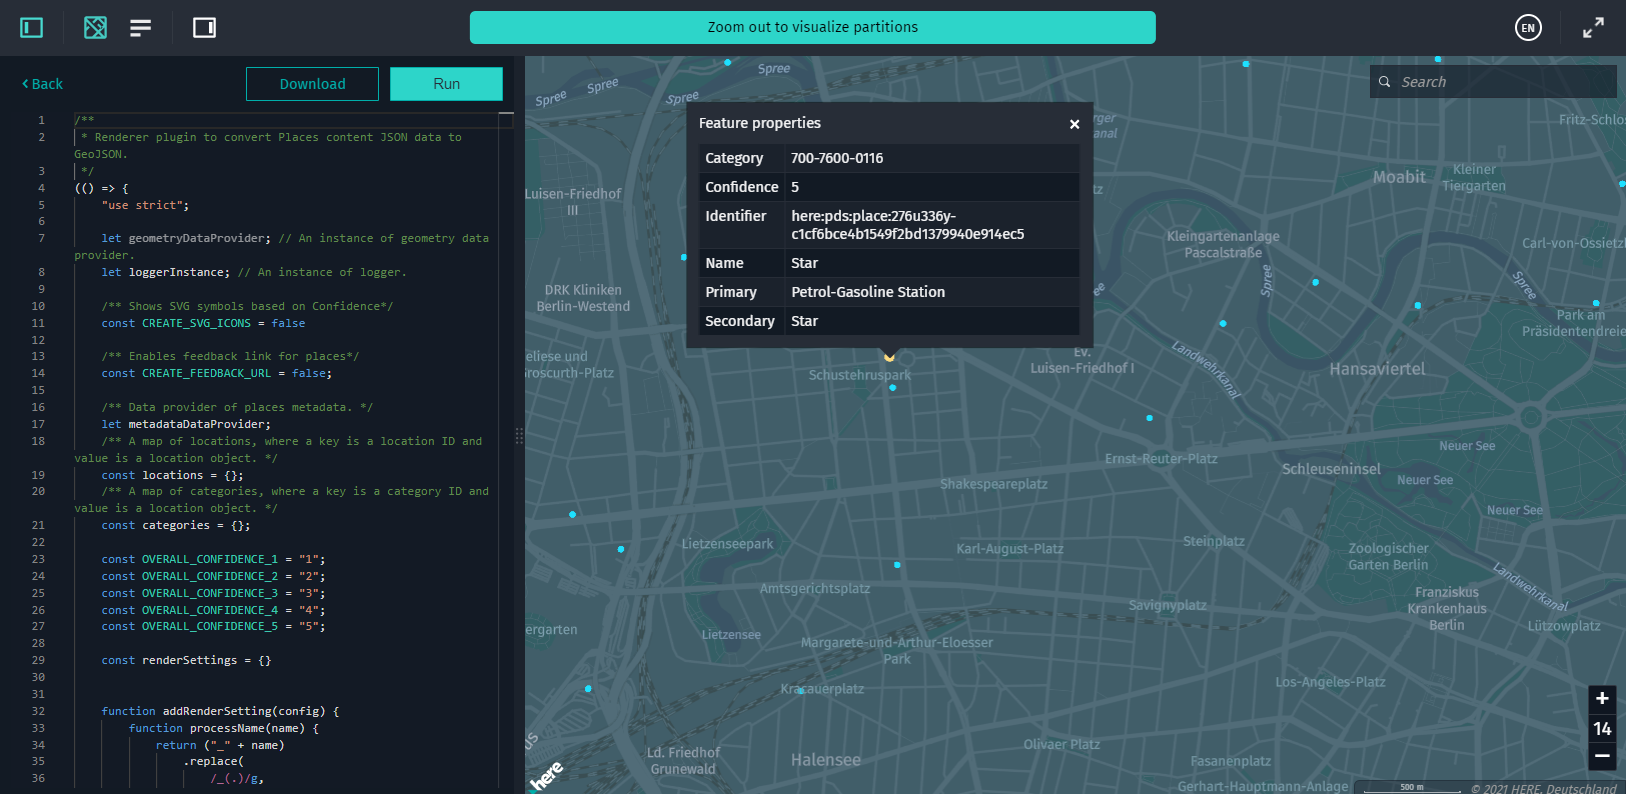
Figure 1. Fueling stations 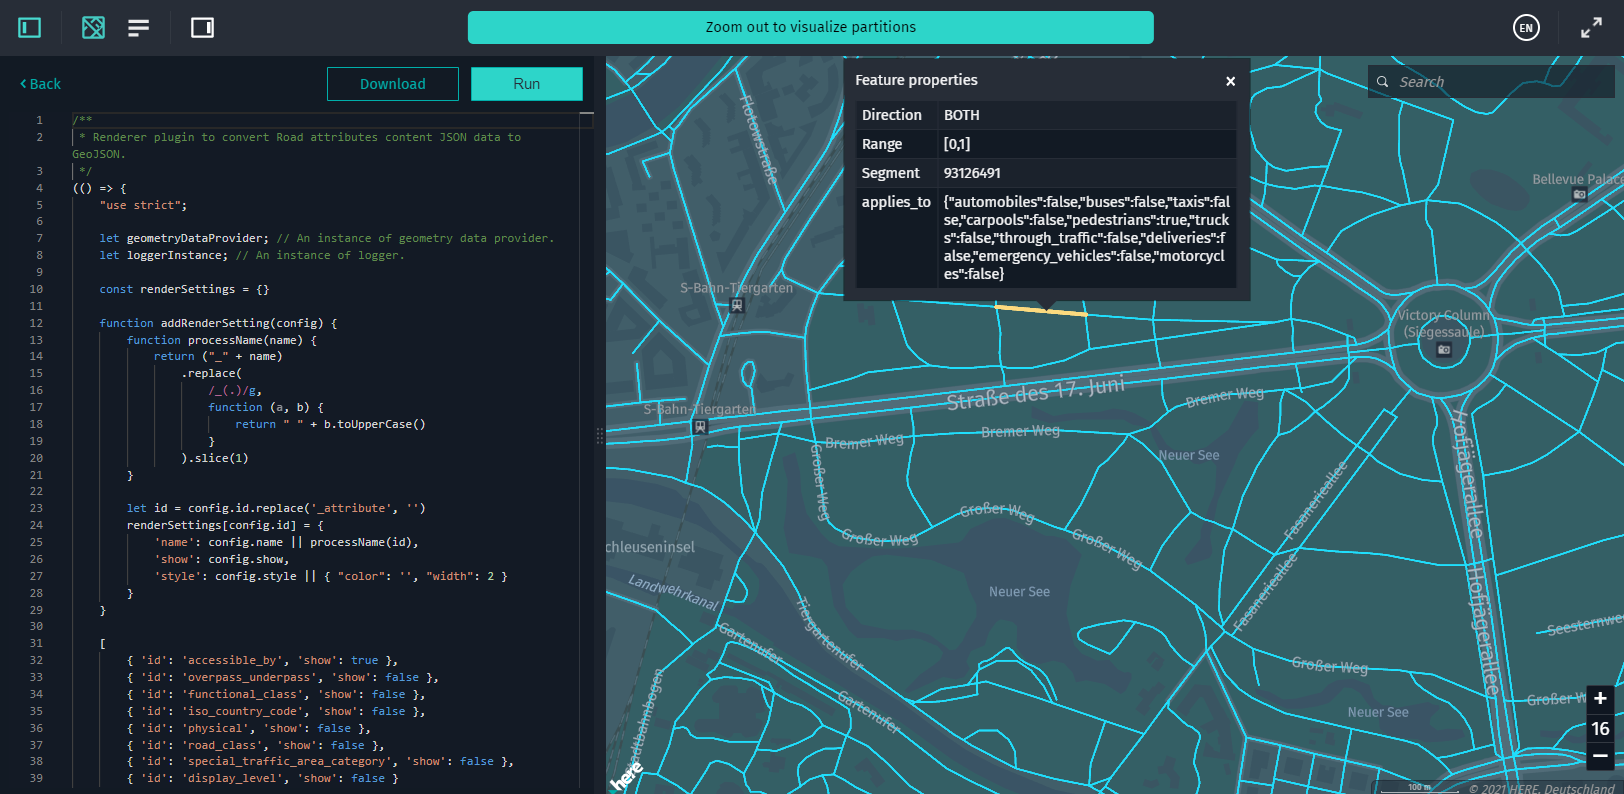
Figure 2. Multi-carriageways and motorway interchanges with ramps grouped to enable creation of a basic representation -
GeoJSON data visualized with the dedicated GeoJSON rendering engine:
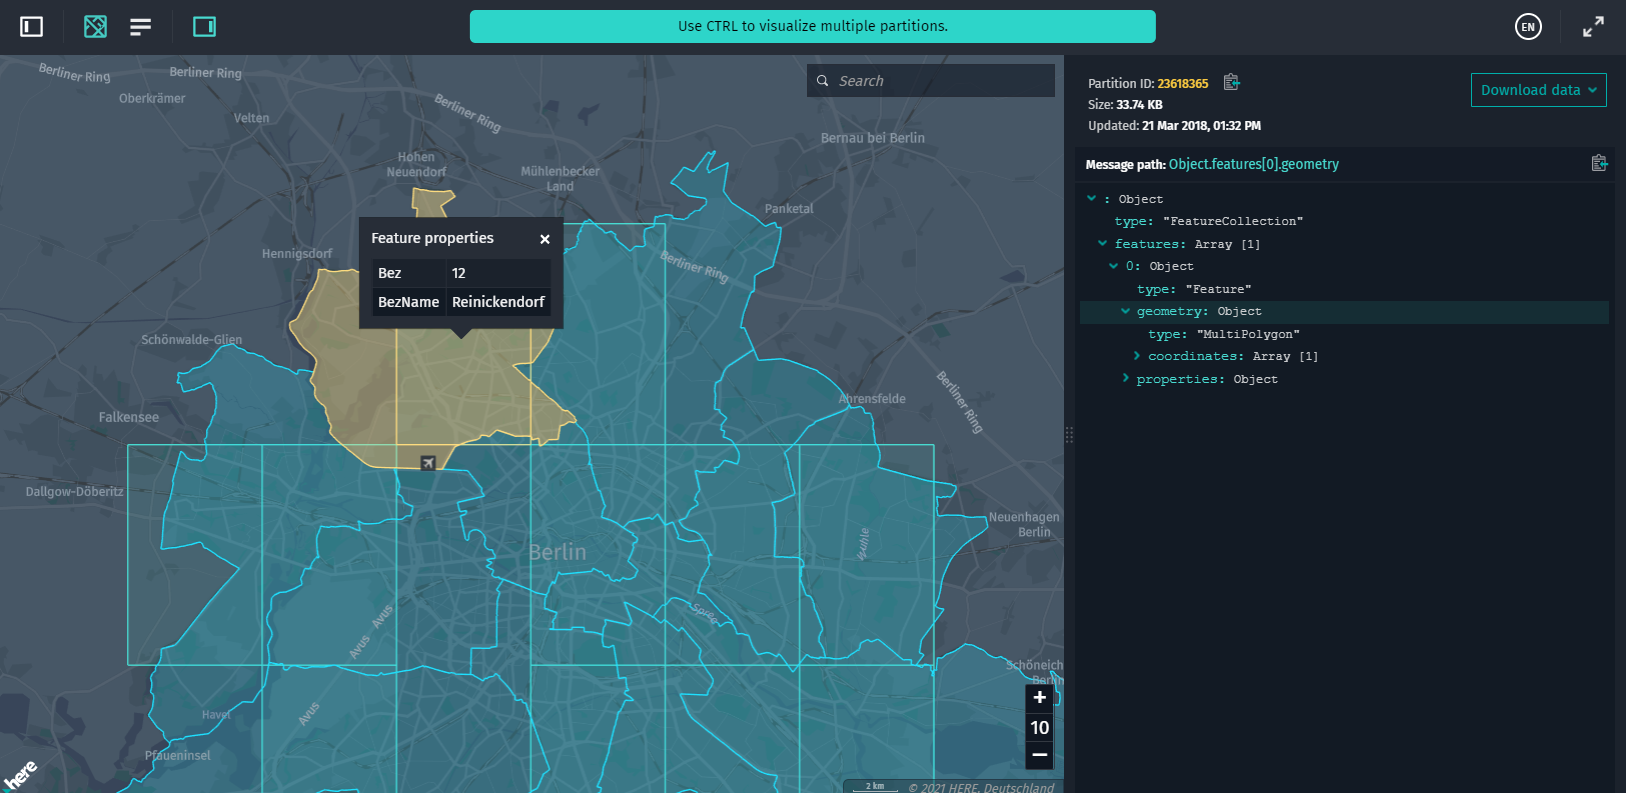
Figure 3. Outlines of Berlin districts partitioned by the geographic center of each polygon -
Several layers from the HERE Map Content catalog (Cartography, Roads - Topology & Geometry, and Building Footprints) visualized out of the box with the special rendering engine:
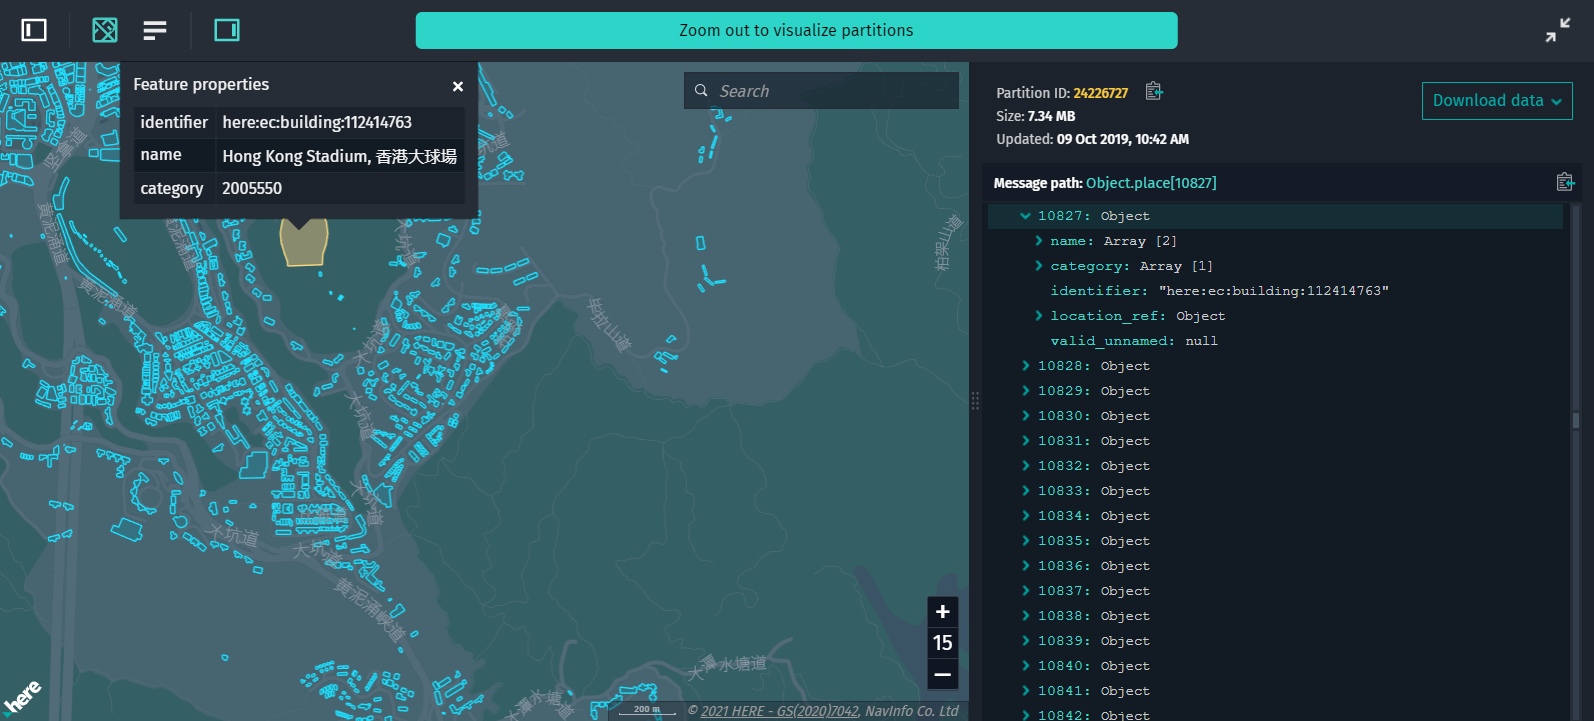
Figure 4. Building footprints -
Vehicle sensor data (Sensor Data Ingestion Interface (SDII)) visualized with the dedicated rendering engine that requires no specific rendering plugin:
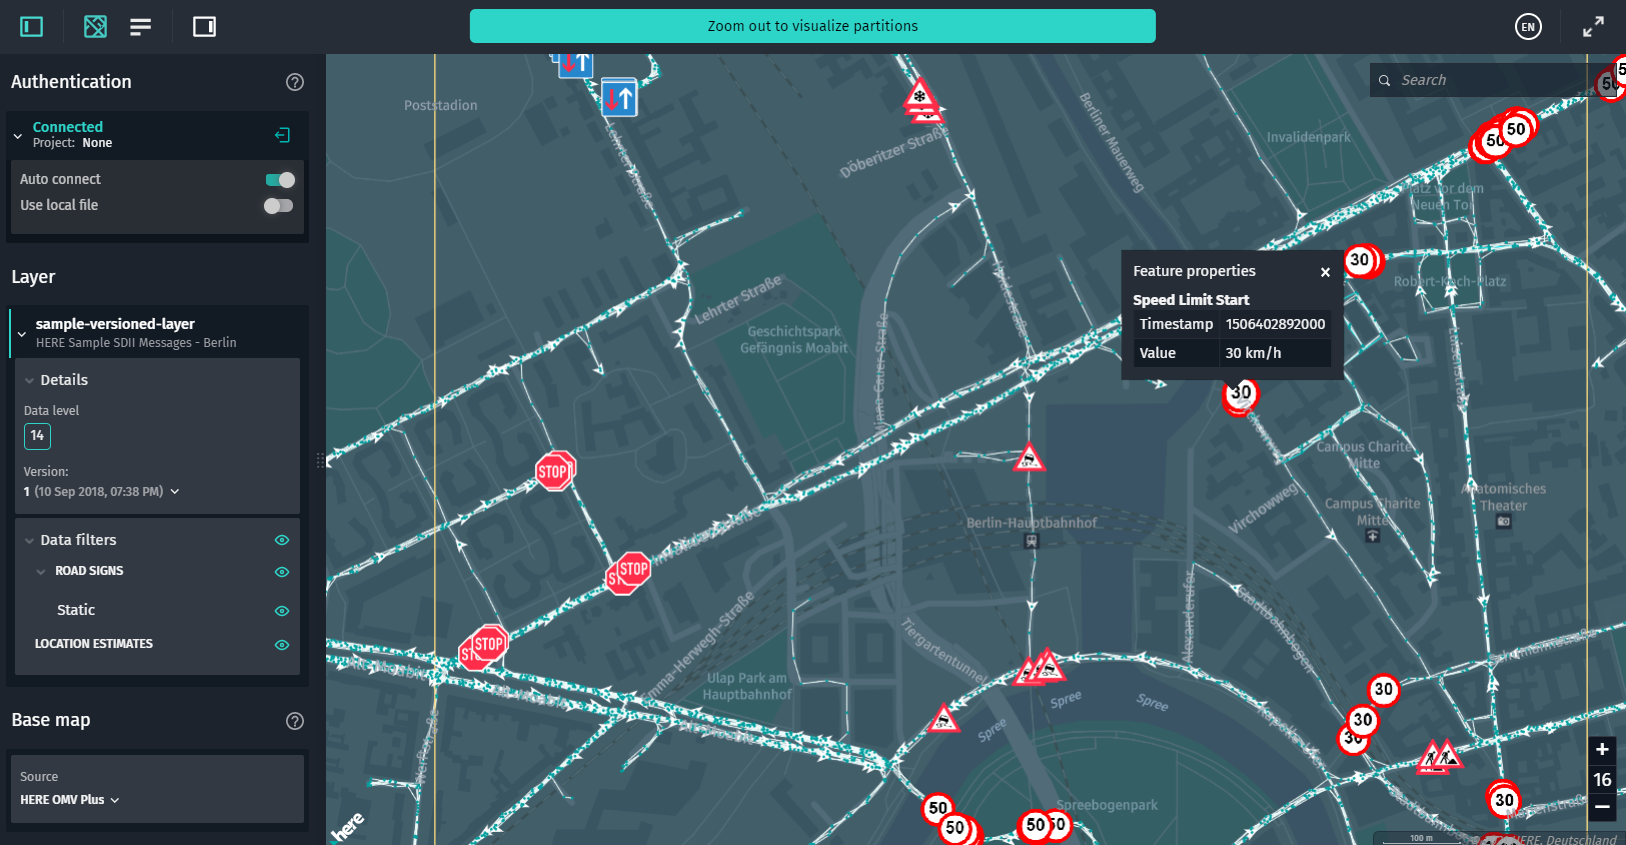
Figure 5. Vehicle sensor data(SDII)
The Data Inspector is available as a component integrated in the HERE platform portal as well as in form of a library. For most cases, the portal application is all you need. You can even develop a rendering plugin there. The Data Inspector Library lets you create a customized Data Inspector tool for special cases that you might have. For more information, see the use cases in the chapter below.
Why Use the Data Inspector Library
The Data Inspector Library allows you to do the following:
- Discover the coverage of data that is stored in the platform
- Inspect the data that is available in the platform
- Inspect the data while developing your platform pipeline applications
- Create your own application with the contents of your catalogs.
Discover Platform Data Coverage
Whenever searching for certain types of data stored in the platform, one of the first things you may be interested in is where that data is available geographically.
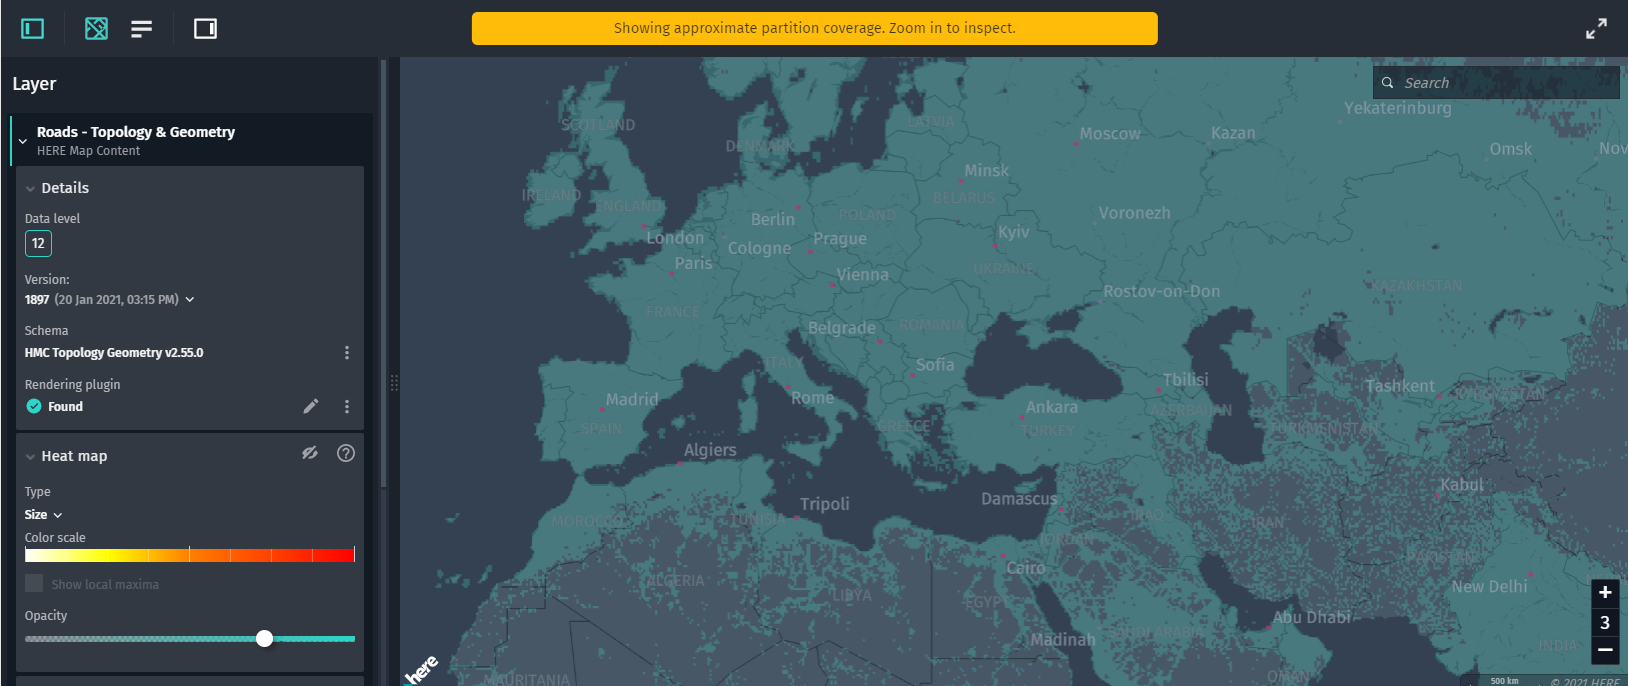
For HERETiled layers, the Data Inspector provides a coverage map (as a green overlay on top of the base map) that shows the geographical distribution of layer data on a global or local sale, depending on a zoom level.
But if the data is generically partitioned, then there is no way of knowing where the data would be at until you load the data itself – and that can be a very heavy operation. In that case, the platform still offers you the possibility to state in which countries your data is available through a layer description.
Inspect Platform Data
The information on the layer's page in the portal can help you out, of course, but to know more about the data, use the Data Inspector. This tool brings lots of data inspection capabilities, including those listed below:
- Learn in more detail where exactly tiles with data can be expected.
- View where the larger tiles of data (in KB or MB) are available.
- Visualize the layer content's geometry of one or more tiles on the base map to see if the geometry is correct.
- Inspect layers with multiple data levels by selecting one specific level and visualizing only the data that is stored on that specific level.
- Study the data structure and attribute values in a specific tile, so that you can find out if it fits your purpose without having to code a single line.
- Inspect non-tiled (generically partitioned) data that cannot be visualized from within the Data Inspector as a list of partitions.
For more information on inspection capabilities, see the How To chapters.
Inspect Pipeline Outputs
As a platform pipeline developer, you take platform data as your pipeline input. Then, to ensure that every processing stage fits your overall purpose, you can inspect your pipeline output with the Data Inspector.
The Data Inspector Library allows you to:
-
View visualized partition data directly in the platform Data Inspector. For this, though, your schema with rendering plugins must be deployed to the platform and bundled with a layer. Equally, your pipeline application must be deployed to the platform, configured, and launched in Pipeline API.
-
View a local (off-line) partition exactly as it will be visualized in the portal. You can also view a local schema (and rendering plugin) exactly as it would be visualized in the portal. This is the convenient way since all the pipeline development and testing is happening on your local staging environment. Once completed, you deploy a perfectly finetuned pipeline application to the platform.
For more information, see Pipelines Developer Guide.
Scale Visualization with Custom Plugins
The platform is extremely flexible in how it allows you to store and structure your data. Every layer can be tiled or non-tiled, and every layer can have its own data format. However, you are recommended to store your data in HERE tiles in GeoJSON or in Protobuf with a well-defined Protobuf schema.
HERETiled GeoJSON layers can be instantly visualized by the Data Inspector.
And HERETiled Protobuf layers can be visualized with custom JavaScript plugins that are used to convert Protobuf-encoded data to GeoJSON and visualize it. To simplify rendering plugin development, the Data Inspector includes an integrated environment where you can code and immediately test your rendering plugins on a specific Protobuf schema.
For more information on rendering plugins, see Create Rendering Plugins.
Build Custom Apps
Once data is stored in the platform, you are not limited to the visualization options offered online. With the Data Inspector Library, you can create, for instance, complete off-platform web dashboards or admin web tools that can visualize your data with the JavaScript libraries of your own preference. The Data Inspector Library allows you to access platform data directly with JavaScript and to show that data on top of your preferred maps libraries (OpenLayers and the like).
For more information, see Library Modules Overview.
Next Steps
To start using the Data Inspector Library, see Get started
For the terms and conditions covering this documentation, see the HERE Documentation License.
HERE is committed to respecting your privacy and to complying with applicable data protection and privacy laws. For more information, see the HERE Privacy Charter.
For more information on HERE data security and durability best practices, see the Data API.