- Products ProductsLocation Services
Solve complex location problems from geofencing to custom routing
PlatformCloud environments for location-centric solution development, data exchange and visualization
Tracking & PositioningFast and accurate tracking and positioning of people and devices, indoors or outdoors
APIs & SDKsEasy to use, scaleable and flexible tools to get going quickly
Developer EcosystemsAccess Location Services on your favorite developer platform ecosystem
- Documentation DocumentationOverview OverviewServices ServicesApplications ApplicationsDevelopment Enablers Development EnablersContent ContentHERE Studio HERE StudioHERE Workspace HERE WorkspaceHERE Marketplace HERE MarketplacePlatform Foundation and Policy Documents Platform Foundation and Policy Documents
- Pricing
- Resources ResourcesTutorials TutorialsExamples ExamplesBlog & Release Announcements Blog & Release AnnouncementsChangelog ChangelogDeveloper Newsletter Developer NewsletterKnowledge Base Knowledge BaseFeature List Feature ListSupport Plans Support PlansSystem Status System StatusLocation Services Coverage Information Location Services Coverage InformationSample Map Data for Students Sample Map Data for Students
- Help
Last Updated: August 31, 2020
Introduction
This tutorial is a detailed introduction to the Maps API for JavaScript 3.1.
The Maps API for JavaScript was refreshed in 2019 to include some key new features: - vector rendering - customization of the map’s look and feel - runtime change of the map style - ability to hide/show base map data layers at the runtime - map tilting and rotation - extruded buildings - fractional zoom levels - interactive traffic flow information - rich interactions with the map - retrieve feature’s meta information - introduction of APIKey as new authentication method
In this tutorial, you will create a feature-rich isoline routing visualization application.
You’ll learn how to: - set up an interactive map with controls and events. - integrate the Isoline Routing API using the built-in JavaScript bindings to the HERE location service APIs. - dynamically change the isoline parameters and map style. - provide search suggestions using the HERE Geocoding Autocomplete API. - implement some slick CSS transitions.
You can view the completed version of the application here.
Let’s get started!
Download the template
To get started with the tutorial, please download the template code: - template code
The template code is provided so you can focus on implementing the Maps API code instead of focusing on trivial details like CSS.
When you download and unzip the template, you’ll see the following file structure:
|--template
   |--index.html
   |--css
      |--index.css
      |--search.css
      |--sidebar.css
   |--js
      |--app.js
      |--config.js
      |--helpers.js
   |--resources
      |-- ...
|-- ...-
index.htmlcontains the app’s HTML. You will only have to make minor edits to this file. - the
cssdirectory contains the app’s css. You won’t have to make any changes to these files. - the
jsdirectory contains all the application’s logic. Throughout the tutorial, we’ll be working with these files (and adding new ones). - the
resourcesdirectory contains various assets like fonts, icons, and images. You won’t have to make any changes to these files.
You’ll also want to start a local server during development.
For example in Python 2.x, run the following command:
python -m SimpleHTTPServer 8888and in Python 3.x:
python -m http.server 8888You can then open your browser and view the app at localhost:8888
Some notes on helper functions
The file js/helpers.js contains various helper functions like query selectors, date formatters, and label formatters.
Throughout this tutorial, you will see the symbols $ and $$ a few times. These symbols are helper functions for querying the DOM.
const $ = q => document.querySelector(q);
const $$ = qq => document.querySelectorAll(qq);
These are just shorthand functions that reference the native DOM methods querySelector() and querySelectorAll() in order to help with readability of our code. They may remind you of jQuery.
Initialize the platform and map
Let’s get started by adding the Maps API for JavaScript imports.
Inside of index.html add the following script imports to your document’s <head>:
index.html
<!-- JS API -->
<link rel="stylesheet" type="text/css" href="https://js.api.here.com/v3/3.1/mapsjs-ui.css" />
<script src="https://js.api.here.com/v3/3.1/mapsjs-core.js"></script>
<script src="https://js.api.here.com/v3/3.1/mapsjs-service.js"></script>
<script src="https://js.api.here.com/v3/3.1/mapsjs-ui.js"></script>
<script src="https://js.api.here.com/v3/3.1/mapsjs-mapevents.js"></script>
Next, we’ll add our HERE platform credentials:
Inside of config.js, edit the hereCredentials object to add your App Id, App Code, and API Key:
config.js
const hereCredentials = {
   apikey: 'YOUR-HERE-APIKEY'
}
You can find this information in the Projects section of your Developer Portal account.
Let’s switch over to the file called app.js. This is where we will initialize the JavaScript map.
Inside of app.js, paste the following code:
app.js
/* ...
 * Existing app.js code goes here
 * ...
 */

// Initialize HERE Map
const platform = new H.service.Platform({ apikey: hereCredentials.apikey });
const defaultLayers = platform.createDefaultLayers();
const map = new H.Map(document.getElementById('map'),       defaultLayers.vector.normal.map, {
   center,
   zoom: 12,
   pixelRatio: window.devicePixelRatio || 1
});
const behavior = new H.mapevents.Behavior(new H.mapevents.MapEvents(map));
const provider = map.getBaseLayer().getProvider();

//Initialize router and geocoder
const router = platform.getRoutingService();
const geocoder = platform.getGeocodingService();

window.addEventListener('resize', () => map.getViewPort().resize());

export { router, geocoder }
In the code above, we’ve:
- initialized the platform and basic interactive map.
- added behavior controls and events. This way we can pan around the map. Try holding down either option (Mac) or alt (Windows) to have fun panning around the map in 3D!
- initialize the router and geocoding service. We’ll be using these later on in the tutorial.
- added an event listener to the window to make sure the map resizes when the browser changes sizes.
If you save the file and refresh, you’ll see a basic map up and running!
Add a draggable marker
We’ll want to enable the user to pick a starting point of the isoline by either searching for a city location or by dragging and dropping a marker. Whenever a marker’s location is changed, we’ll want to recalculate the isoline.
Let’s add a marker to the map and enable its position to be changed. Inside of app.js, paste the following code:
app.js
/* ...
 * map and platform code from previous section goes here
 * ...
 */

let polygon;
const marker = new H.map.Marker(center, {volatility: true});
marker.draggable = true;
map.addObject(marker);

// Add event listeners for marker movement
map.addEventListener('dragstart', evt => {
   if (evt.target instanceof H.map.Marker) behavior.disable();
}, false);
map.addEventListener('dragend', evt => {
   if (evt.target instanceof H.map.Marker) {
      behavior.enable();
      calculateIsoline();
   }
}, false);
map.addEventListener('drag', evt => {
   const pointer = evt.currentPointer;
   if (evt.target instanceof H.map.Marker) {
     evt.target.setGeometry(map.screenToGeo(pointer.viewportX, pointer.viewportY));
   }
}, false);
We’ll create a new marker with the variable marker and add it to the map. Next, we’ll add some event listeners to the map. We’ll listen to some events: - on dragstart, we’ll want to disable the normal behavior so the marker can be dragged. - on drag, we’ll want to update the marker’s geometry to wherever it’s being dragged. - finally, on dragend, we’ll want to recalculate the isoline. Later on, we’ll introduce a function called calculateIsoline(), which will do just that.
Go ahead and save the file and give it a try! Since the calculateIsoline() function doesn’t yet exist, the map will give a small error. Try commenting the calculateIsoline() line temporarily to test out dragging the marker.
Calculate an isoline
Now that we have a map with a draggable marker, let’s start adding the isoline functionality.
Let’s separate the isoline request into a different file.
Create a new file inside of the js directory called here.js and paste the following code:
here.js
import { router } from './app.js';

const isolineMaxRange = {
   time: 32400, //seconds
   distance: 80000 //meters
}

const requestIsolineShape = options => {
   const params = {
      'mode': `fastest;${options.mode};traffic:enabled`,
      'start': `geo!${options.center.lat},${options.center.lng}`,
      'range': options.range,
      'rangetype': options.rangeType,
      'departure': `${options.date}T${options.time}:00`,
   };

   return new Promise((resolve, reject) => {
      router.calculateIsoline(
         params,
         res => {
            const shape = res.response.isoline[0].component[0].shape.map(z => z.split(','));
            resolve( shape )
         },
         err => reject(err)
      );
   })
}

export { requestIsolineShape, isolineMaxRange }
We’ll need to import the router from our main app.js file so it can be used here.
We create the function requestIsolineShape that will make the request to the HERE Routing API for us. The JavaScript API conveniently wraps this request for us with the router.calculateIsoline() option.
The function we’ve made, requestIsolineShape(), will return a promise that will get resolved once the response from the HERE server is made.
We’ll pass it a few different parameters, all of which will be configured by the application user from the sidebar UI. - mode: choice between pedestrian, car, or truck. This parameter will also contain the flag to enable traffic or not. - start: the coordinates of the isoline center point. - range: the range isoline. Example: 4000. - rangetype: distance (meters) or time (seconds). - departure: if traffic is enabled, the date and time of departure.
For more example on isoline routing, we have a few blog posts available on the topic:
…or check out the official documentation.
Next, let’s head back to our app.js file to set up some logic on when to calculate an isoline.
Let’s create a new function called calculateIsoline():
We’ll want to add the word async before the function to take advantage of the ES6 async/await functionality.
app.js
import { isolineMaxRange, requestIsolineShape } from './here.js';

/* ...
 * map and marker code from previous sections go here
 * ...
 */

async function calculateIsoline() {
   console.log('updating...')

   //Configure the options object
   const options = {
      mode: $('#car').checked ? 'car' : $('#pedestrian').checked ? 'pedestrian' : 'truck',
      range: $('#range').value,
      rangeType: $('#distance').checked ? 'distance' : 'time',
      center: marker.getGeometry(),
      date: $('#date-value').value === '' ? toDateInputFormat(new Date()) : $('#date-value').value,
      time: to24HourFormat($('#hour-slider').value)
   }

   //Limit max ranges
   if (options.rangeType === 'distance') {
      if (options.range > isolineMaxRange.distance) {
         options.range = isolineMaxRange.distance
      }
      $('#range').max = isolineMaxRange.distance;
   } else if (options.rangeType == 'time') {
      if (options.range > isolineMaxRange.time) {
         options.range = isolineMaxRange.time
      }
      $('#range').max = isolineMaxRange.time;
   }

   //Format label
   $('#slider-val').innerText = formatRangeLabel(options.range, options.rangeType);

   //Center map to isoline
   map.setCenter(options.center, true);
}
We’ll create an object called options to store the isoline options. Whenever a new isoline will be calculated, we’ll pass these options to the API.
Since the Isoline API has different maximums for the time and distance options, we’ll want to stop some potential errors caused from the range slider.
Additionally, we’ll want to update the HTML label and set the map’s center to the center of the isoline.
Draw an isoline polygon
So far, we’ve written the logic to calculate an isoline. The next step is to add it to the map. To do this, we’ll want to - initialize an empty LineString to hold our isoline response data. - add the isoline response data to the linestring. - create a polygon object from the isoline response (and remove the existing polygon). - add the polygon to the map.
Add the following code into the calculateIsoline() function inside of app.js:
app.js
async function calculateIsoline() {
/* ...
* options and other code from previous section goes here...
* ...
*/
const linestring = new H.geo.LineString();
const isolineShape = await requestIsolineShape(options);
isolineShape.forEach(p => linestring.pushLatLngAlt.apply(linestring, p));
if (polygon !== undefined) {
map.removeObject(polygon);
}
polygon = new H.map.Polygon(linestring, {
style: {
fillColor: 'rgba(74, 134, 255, 0.3)',
strokeColor: '#4A86FF',
lineWidth: 2
}
});
map.addObject(polygon);
}
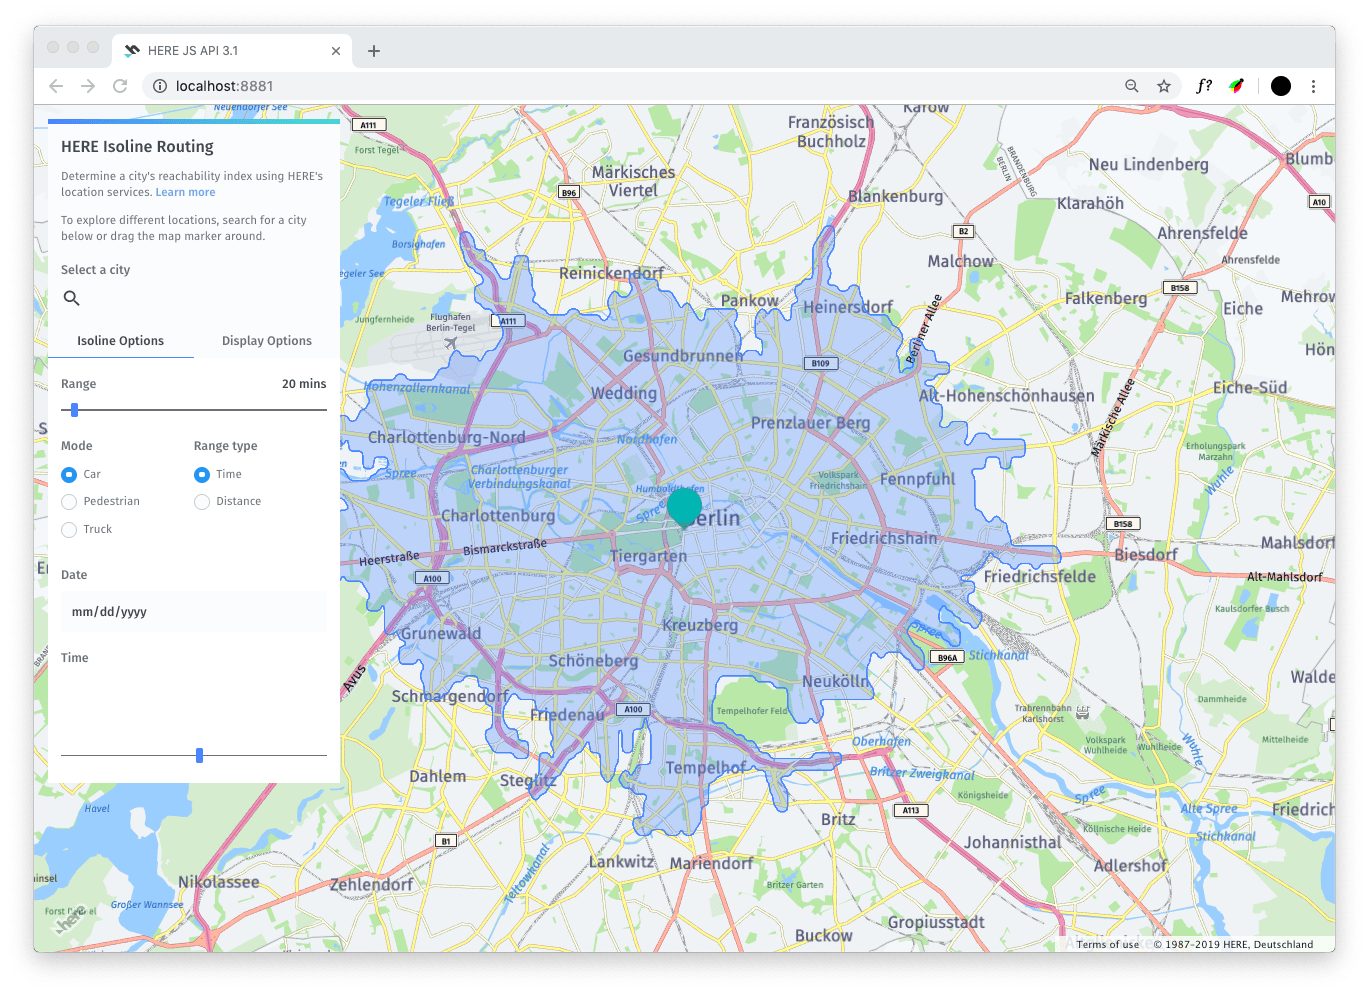
calculateIsoline();If you save the file and refresh your browser, you should now having a working isoline! Try dragging around the marker to see an isoline from a new location.
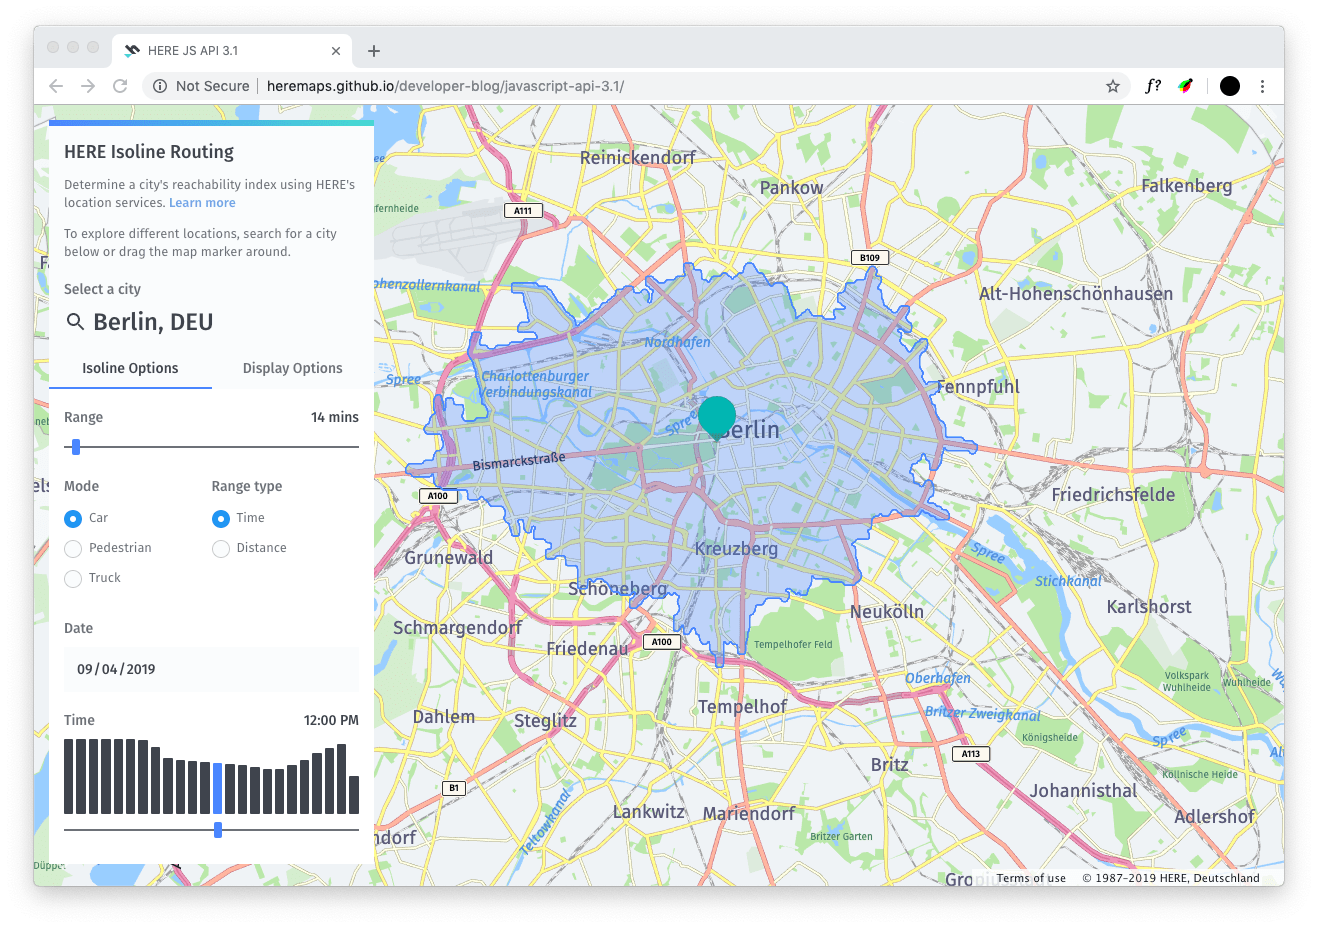
Create the bar chart
If you take a look at the live version of the finished application, you’ll notice that the sidebar contains a bar chart.
This bar chart shows the distribution of the total area of the isoline at each hour of the day. If a bar has a short height, it means you can’t travel as far as you could at an hour with a higher bar height.
We’ll write this bar chart using a ES6 Class. If you have a background with object oriented programming, a javascript class operates the same as an object or class in another language.
To implement this bar chart and associated slider, we’ll create a new file called HourFilter.js.
HourFilter.js
import { $, toAMPMFormat } from './helpers.js';

class HourFilter {
   constructor() {
      this.graph = $('.graph');
      this.slider = $('#hour-slider');
      this.sliderLabel = $('#hour-slider-val');
      this.noGraphLabel = $('.no-graph-text');

      this.slider.oninput = () => {
         this.highlightBar(this.slider.value);
         this.updateLabel(this.slider.value);
      }
      this.bars = [];
      for (let i = 0; i < 24; i++) {
         const barContainer = document.createElement('div');
         barContainer.classList.add('bar-container');
         const bar = document.createElement('div');
         bar.classList.add('bar');
         bar.style.height = '0%';
         barContainer.appendChild(bar);
         this.graph.appendChild(barContainer);
         this.bars.push(bar);
      }
   }

   setData(data) {
      this.noGraphLabel.style.opacity = 0;
      this.slider.style.opacity = 1;
      this.sliderLabel.style.opacity = 1;

      const max = Math.max.apply(null, data);
      this.bars.forEach((bar, i) => {
         const percentHeight = data[i] / max * 100 + '%';
         bar.style.height = percentHeight;
      })

      this.highlightBar(this.slider.value);
      this.updateLabel(this.slider.value);
   }

   updateLabel(value) {
      this.sliderLabel.innerText = toAMPMFormat(value);
   }

   highlightBar(value) {
      this.bars.forEach(b => b.style.background = '');
      this.bars[value].style.background = 'var(--accent)';
   }

   hideData() {
      this.bars.forEach(bar => bar.style.height = '0px');
      this.noGraphLabel.style.opacity = 1;
      this.slider.style.opacity = 0;
      this.sliderLabel.style.opacity = 0;
      this.noGraphLabel.style.cursor = 'not-allowed';
   }
}

export default HourFilter;
There’s quite a lot going on in this class, so let’s break down what’s happening.
Inside the constructor, we’ll be initializing some values (the html elements) and adding event listeners for when the slider is changed. We’ll also create 24 different bar items for our bar chart.
Whenever the bar chart’s data needs to be updated, we’ll call the setData() function. This function takes the input data and calculates a height of each individual bar using a CSS percentage value.
We’ll also include some additional functions like: - updateLabel() in order to update the HTML label. - highlightBar() in order to highlight the selected hour bar when the slider is changed. - and hideData() to temporarily hide the bar chart when the transportation mode does not equal car and range type does not equal time. This is because the traffic parameter of the isoline api only works on transportation mode car and range type time.
Let’s head back to our main app.js and implement this code into the app.
app.js
//Don't forget to import the `HourFilter` class!
import HourFilter from './HourFilter.js';

/* ...
* all app.js code goes here...
* ...
*/

//Initialize the HourFilter
const hourFilter = new HourFilter();
async function calculateIsoline() {
   /* ...
   * all previous calculateIsoline code goes here
   * ...
   */

   //Enable bar graph for car and time options
   if (options.mode === 'car' && options.rangeType === 'time') {
      const promises = [];
      for (let i = 0; i < 24; i++) {
         options.time = to24HourFormat(i);
         promises.push(requestIsolineShape(options))
      }
      const polygons = await Promise.all(promises);
      const areas = polygons.map(x => turf.area(turf.polygon([x])));
      hourFilter.setData(areas);
   } else {
      hourFilter.hideData();
   }
}
The first things we’ll do will be: - import HourFilter into our app.js file - initialize HourFilter
Then, inside of calculateIsoline(), we’ll want to make use of the HourFilter. Whenever the mode is car and range type is time we’ll make 24 requests to the isoline api (one for each hour). We’ll be using the helpful Promise.all() syntax to make concurrent requests to improve performance.
Using a handy helper function from Turf, we can calculate the square area of each polygon. These are the values we’ll be visualizing in the bar chart.
Finally, we’ll set the data with hourFilter.setData().
Save your file and refresh the page and you’ll see a functioning bar chart! We haven’t yet set up the slider to update the time of day yet, but you can test out the bar chart by dragging around the map marker.
Enable the UI controls
So far we’ve got a functioning map and semi-functional sidebar. Let’s make the sidebar come alive.
Manage initial state and add event listeners
First, let’s set some initial values on our sidebar. We’ll also want to add event listeners to all the different forms. This way, whenever a value is changed in the HTML, the isoline will update.
app.js
/* ...
* This code can go near the top of the file
* ...
*/

//Manage initial state
$('#slider-val').innerText = formatRangeLabel($('#range').value, 'time');
$('#date-value').value = toDateInputFormat(new Date());

//Add event listeners
$$('.isoline-controls').forEach(c => c.onchange = () => calculateIsoline());
$$('.view-controls').forEach(c => c.onchange = () => calculateView());
Now try changing some of the following elements: - slider for isoline range - radio buttons for transportation mode - radio buttons for range type - date picker - slider for the time of day
You’ll see the isoline start updating!
Tab control
Let’s enable the tab control on the sidebar. If you try to click on the Isoline Options or Display Controls, you’ll notice they don’t do anything.
Add the following to our main file:
app.js
/* ...
* This code can go near the top of the file
* ...
*/

//Tab control for sidebar
const tabs = $$('.tab');
tabs.forEach(t => t.onclick = tabify)
function tabify(evt) {
   tabs.forEach(t => t.classList.remove('tab-active'));
   if (evt.target.id === 'tab-1') {
      $('.tab-bar').style.transform = 'translateX(0)';
      evt.target.classList.add('tab-active');
      $('#content-group-1').style.transform = 'translateX(0)';
      $('#content-group-2').style.transform = 'translateX(100%)';
   } else {
      $('.tab-bar').style.transform = 'translateX(100%)';
      evt.target.classList.add('tab-active');
      $('#content-group-1').style.transform = 'translateX(-100%)';
      $('#content-group-2').style.transform = 'translateX(0)';
   }
}
The above code will enable a smooth transition between the two tabs. You’ll now be able to switch to the second tab.
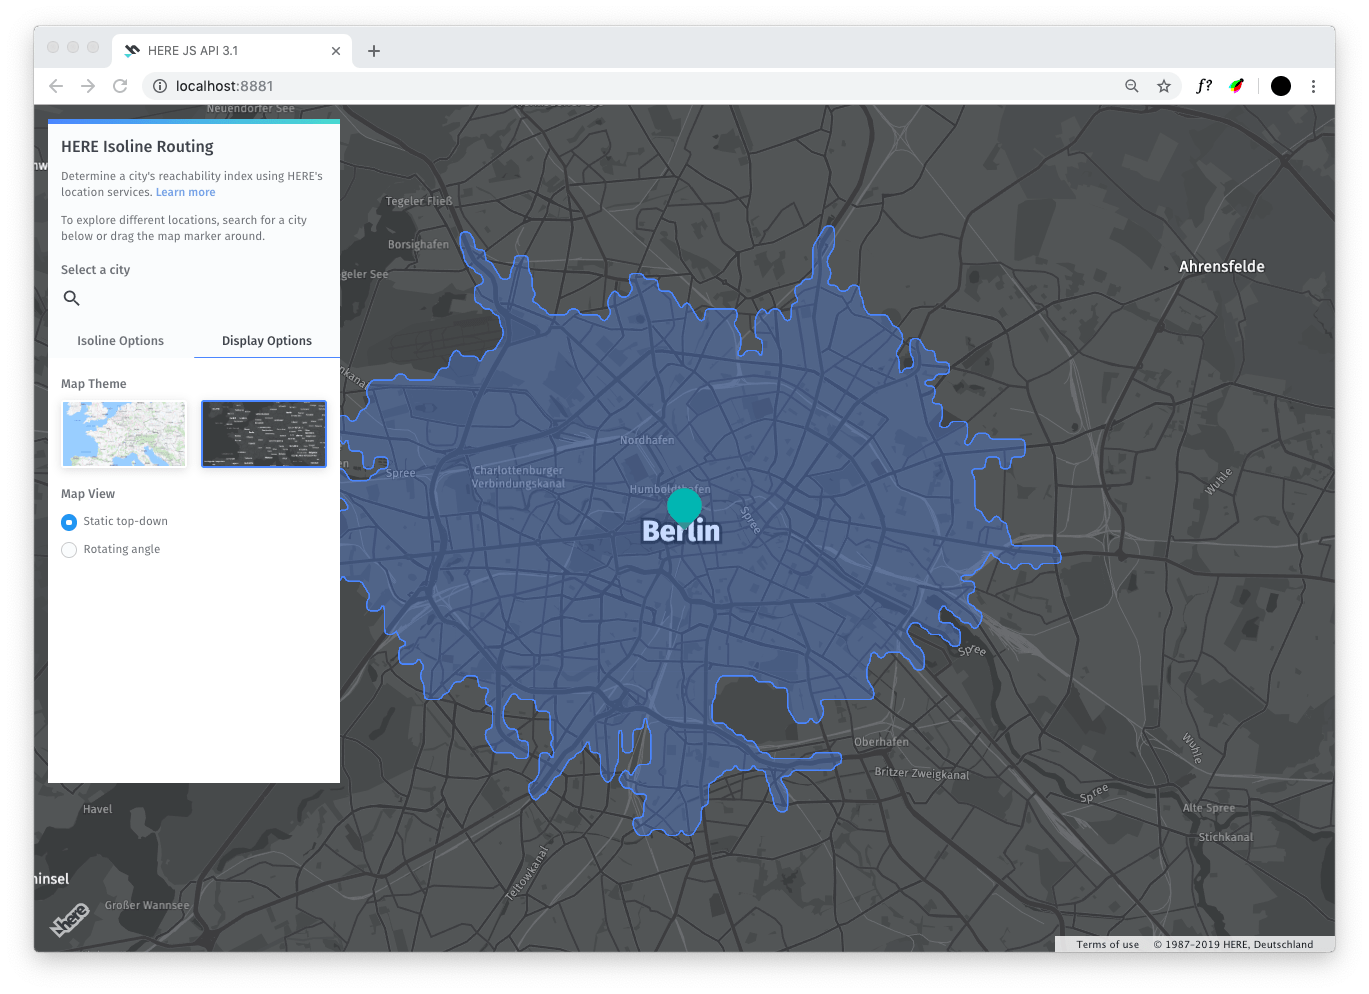
Switch between map themes
Now that we have a functioning sidebar, we can switch to the second tab: Display Options.
As you can see in the UI, we’ve created an HTML element for each theme (day and night). When the user clicks on one of these elements, we’ll want to switch the map theme to that style.
The Maps API for JavaScript can be customized to match any style you like. For more information, please see the docs on map customization.
Inside of the resources folder, there is a file called night.yaml. This is the style file for the dark theme we’ll switch to.
app.js
/* ...
* This code can go near the top of the file
* ...
*/

//Theme control
const themeTiles = $$('.theme-tile');
themeTiles.forEach(t => t.onclick = tabifyThemes);
function tabifyThemes(evt) {
   themeTiles.forEach(t => t.classList.remove('theme-tile-active'));
   evt.target.classList.add('theme-tile-active');
   if (evt.target.id === 'day') {
      const style = new H.map.Style('https://js.api.here.com/v3/3.1/styles/omv/normal.day.yaml')
      provider.setStyle(style);
   } else {
      const style = new H.map.Style('./resources/night.yaml');
      provider.setStyle(style);
   }
}
When the user clicks on the night theme tab, we’ll load the theme from the resources directory and then set it as the maps’ theme. When the user clicks on the day theme tab, we’ll load the default theme from an online location and set it as the map’s theme.
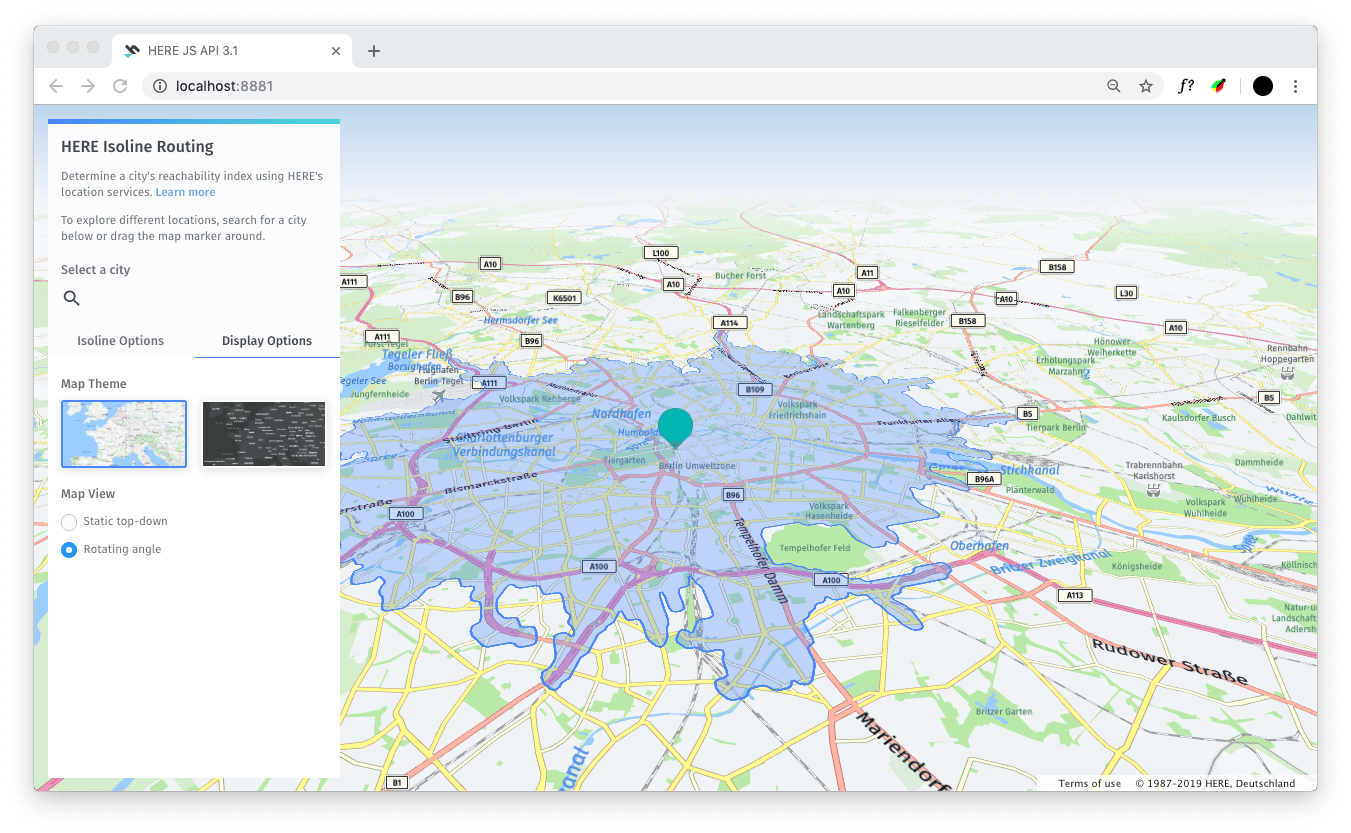
Enable automatic map rotation
In the Display Options tab, you might have noticed there were a pair of radio buttons that showed two different options for map view: - static top-down - rotating angle
The Maps API for JavaScript enables the user to change the horizontal bearing and vertical pitch. Let’s create a cool cinematic rotating effect for fun.
To do so, we’ll create a class called MapRotation. This will live inside a separate file called MapRotation.js.
MapRotation.js
class MapRotation {
   constructor(map) {
      this.map = map;
      this.interval;
      this.heading = this.map.getViewModel().getLookAtData().heading;
   }

   start() {
      this.map.getViewModel().setLookAtData({
         tilt: 60,
         heading: this.heading += 0.015
      }, true);

      setTimeout(() => {
         this.interval = setInterval(() => {
            this.map.getViewModel().setLookAtData({
               tilt: 60,
               heading: this.heading += 0.015
            });
         }, 10)
      }, 300)
   }

   stop() {
      clearInterval(this.interval);
      this.map.getViewModel().setLookAtData({
         tilt: 0,
         heading: 180
      }, true);
   }
}

export default MapRotation;
This class enables two different actions: - start the map rotation with start(). This sets an interval to continuously rotate the map. - stop the map rotation with stop(). This will revert the map back to the top-down view.
And we’ll implement the rotation in our main app.js file:
app.js
import MapRotation from './MapRotation.js';
/* ...
* The rest of app.js goes here
* ...
*/
const rotation = new MapRotation(map);
function calculateView() {
   const options = {
      theme: $('#day').checked ? 'day' : 'night',
      static: $('#static').checked
   }
   if (options.static) {
      rotation.stop();
   } else {
      rotation.start();
   }
}
Now whenever the rotating angle radio button is clicked, you’ll get an effect like this:
Enable geocoding and autocomplete
In the next step, we’ll be implementing the search input in our application’s sidebar. However, before we can enable the search input, we’ll need to set up both geocoding and geocoding autocomplete.
For the geocoding, we’ll create a similar helper function to requestIsolineShape(). This time it will be called requestGeocode() and it will hit the Geocoding API instead of the Routing Isoline API.
Add the following functions to here.js:
here.js
import { hereCredentials } from './config.js';
import { router, geocoder } from './app.js';

const requestGeocode = locationid => {
   return new Promise((resolve, reject) => {
      geocoder.geocode(
         { locationid },
         res => {
            const coordinates = res.Response.View[0].Result[0].Location.DisplayPosition;
            resolve(coordinates);
         },
         err => reject(err)
      )
   })
}

const autocompleteGeocodeUrl = (query) =>
`https://autocomplete.geocoder.ls.hereapi.com/6.2/suggest.json?apiKey={YOUR_API_KEY}
&resultType=areas
&query=${query}`

export {
   autocompleteGeocodeUrl,
   isolineMaxRange,
   requestGeocode,
   requestIsolineShape
}
You may notice that the autocompleteGeocodeUrl function only returns a url as a string, and not a Promise of the api response. This is because the Geocoder Autocomplete API is only available as a REST API and does not have any JavaScript api bindings.
Don’t forget to update the imports and exports for the file to account for the new functions!
Implement search
The final step to completing the application is to enable the search field! We’d like to have a search field so users can quickly navigate to the city of their choice.
In the sidebar search field, we’ll provide an autocomplete suggestion based off the user’s input using the Geocoder Autocomplete API.
We’ll implement search using an ES6 Class. Create a new file called Search.js.
Search.js
import { $ } from './helpers.js';
import { autocompleteGeocodeUrl, requestGeocode } from './here.js';
import { center } from './config.js';
import { calculateIsoline, marker } from './app.js';

class Search {

   constructor(startLocation) {
      this.active = 0;
      this.matches = [];
      this.container = $('.search-container');
      this.input = $('.city-field');
      this.input.innerText = startLocation;
      this.input.oninput = (evt) => this.updateField(evt);
      this.input.onkeydown = (evt) => this.onkeyinput(evt);
      this.label = '';
   }

   async updateField(evt) {
      const value = evt.target.innerText;
      if (value.length === 0) {
         return;
      }

      this.matches = await fetch( autocompleteGeocodeUrl(value) ).then(res => res.json());
      const match = this.matches.suggestions.filter(x => x.matchLevel === 'city')[0];

      if (match === undefined) {
         $('.city-field-suggestion').innerText = '';
      } else {
         this.label = match.address.city + ', ' +  match.countryCode;
         this.active = match.locationId;
         $('.city-field-suggestion').innerText = value + this.label.substring(value.length, this.label.length);
      }
   }

   onkeyinput(evt) {
      const code = evt.keyCode;
      if (code === 13 || code === 9) {
         $('.city-field').innerText = this.label;
         $('.city-field-suggestion').innerText = '';
         evt.preventDefault();
         this.selectMatch();
      }
   }

   async selectMatch() {
      const { Latitude: lat, Longitude: lng } = await requestGeocode(this.active);
      center.lat = lat;
      center.lng = lng;
      marker.setGeometry(center);
      calculateIsoline();
   }
}

export default Search;
There may seem like there’s a lot going on in this Class! Whenever a new input is detected in the search field, we’re going to want to make a request to the Geocoder Autocomplete API to retrieve some suggestions.
We’ll take the first suggestion from the API and add that string as the autocomplete suggestion in the search bar. This process will repeat whenever new input is detected.
When the user press the Enter key, we’ll want to select that the suggestion. The Geocoder Autocomplete API gives us a locationid for each result. We’ll use this locationid to make a new request to regular Geocoder API to transform the city name into coordinates.
Once we’ve received the coordinates from the Geocoder API, we’ll want to calculate a new isoline with calculateIsoline() since the center of the isoline has now changed to the location that the user searched for.
Inside of app.js, we’ll also have to make a few changes to enable search to function properly:
app.js
import Search from './Search.js';
/* ...
* The rest of app.js goes here
* ...
*/
new Search('Berlin, DEU');
export { calculateIsoline, marker, router, geocoder }
You should now have a working autocomplete search field.
Conclusion
By completing this tutorial, you now have a functioning isoline application built with the Maps API JavaScript 3.1!
You’ve learned how to:
- set up an interactive map with controls and events
- integrate the Isoline Routing API using the built-in JavaScript bindings to the HERE location service APIs
- dynamically changed the isoline parameters and map style
- provide search suggestions using the HERE Geocoding Autocomplete API
- implement some slick CSS transitions