- Products ProductsLocation Services
Solve complex location problems from geofencing to custom routing
PlatformCloud environments for location-centric solution development, data exchange and visualization
Tracking & PositioningFast and accurate tracking and positioning of people and devices, indoors or outdoors
APIs & SDKsEasy to use, scaleable and flexible tools to get going quickly
Developer EcosystemsAccess Location Services on your favorite developer platform ecosystem
- Documentation DocumentationOverview OverviewServices ServicesApplications ApplicationsDevelopment Enablers Development EnablersContent ContentHERE Studio HERE StudioHERE Workspace HERE WorkspaceHERE Marketplace HERE MarketplacePlatform Foundation and Policy Documents Platform Foundation and Policy Documents
- Pricing
- Resources ResourcesTutorials TutorialsExamples ExamplesBlog & Release Announcements Blog & Release AnnouncementsChangelog ChangelogDeveloper Newsletter Developer NewsletterKnowledge Base Knowledge BaseFeature List Feature ListSupport Plans Support PlansSystem Status System StatusLocation Services Coverage Information Location Services Coverage InformationSample Map Data for Students Sample Map Data for Students
- Help
Vector
HERE Maps API for JavaScript provides an easy way to render vector data provided by the HERE Vector Tile API with the help of the WebGL rendering engine. Maps API for JavaScript provides predefined base map styles and facility method to manipulate map style and visibility of the map features at the map runtime.
Basic vector map
To easily set the map style for a map, you can use the method createDefaultLayers() defined on the Platform class. The method returns an object that holds different map types, while the vector type provides the vector layers. The named layers represent different styles of the map type and can be directly assigned as base layers to the map.
A map type layer can be referenced using the standard JavaScript dot notation. For example, to indicate a vector layer with the normal map style, you can write layers.vector.normal.map, where layers is the name of a variable holding the return value from Platform.createDefaultLayers().
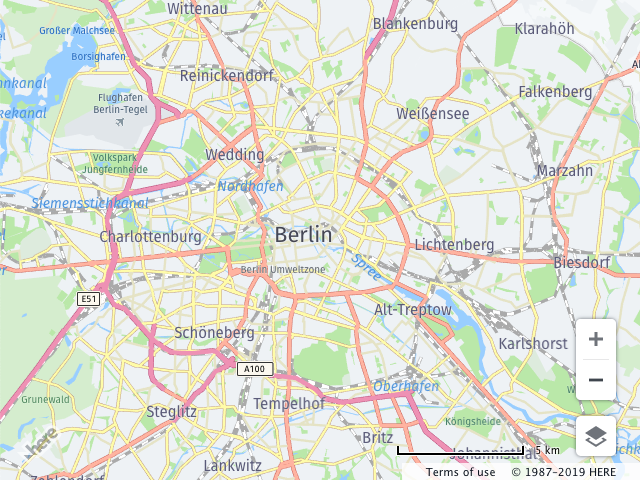
The following example obtains an object holding the default (map types and) layers, and uses them to initialize a Map instance with the vector base layer.
// Create a Platform object (one per application):
var platform = new H.service.Platform({
  'apikey': '{YOUR_API_KEY}'
});

// Get an object containing the default map layers:
var defaultLayers = platform.createDefaultLayers();

// Instantiate the map using the vecor map with the
// default style as the base layer:
var map = new H.Map(document.getElementById('mapContainer'),
            defaultLayers.vector.normal.map);
Execution of this code creates the following image.
Querying style information
You can query and change style information during the map lifetime to highlight features according to new business rules or remove layers that are currently not required in the application. Maps API for JavaScript omv H.service.omv.Provider uses the following methods to modify map style during runtime:
-
extractRenderingConfig- returns the subsection if the configuration method can return either the cloned copy or the section itself. In the latter case, the layer is removed from the configuration and is no longer displayed on the map. -
mergeRenderingConfig- this method merges the configurations supplied by the caller and the provider. -
getRenderingConfig- returns the complete cloned copy of the style configuration as a JavaScript Object. This can be useful if the second version of the map is instantiated with the configuration currently in use, or for the map style inspection.
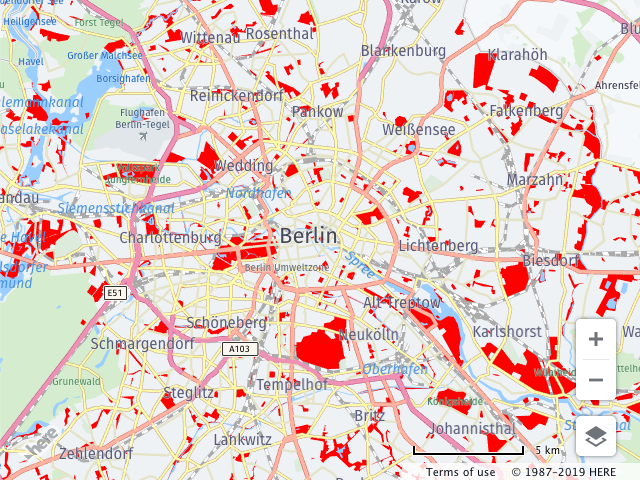
In the following snippet, the park layer is retrieved from the base layer configuration. The color of the park layer changes to bright red and the configuration is merged back into the base layer. Refer to the Style section for an overview of properties that can be changed.
// Assuming that the platform and map were initialized, and
// the map uses vector base layer
// get the OMV provider from the base layer
var provider = map.getBaseLayer().getProvider();

// get the style object for the base layer
var parkStyle = provider.getStyle();

// query the sub-section of the style configuration
// the call removes the subsection from the original configuration
// NOTE: the style MUST be in the "READY" state
var parkConfig = parkStyle.extractConfig(['landuse.park']);

// change the color, for the description of the style section
// see the Developer's guide
parkConfig.layers.landuse.park.draw.polygons.color = '#FF0000'

// merge the configuration back to the base layer configuration
parkStyle.mergeConfig(parkConfig);
Custom Map Styles - Short Introduction
In addition to the default map styles provided by the Platform.createDefaultLayers() factory method, the HERE Map Tile API allows you to create new styles using the on-line Style Editing tool. You can change feature visibility rendered on the base map or at runtime.
Map styling rules follow the general pattern defined by the open-source Tangram rendering engine which specifies configurations in YAML format. The following example defines how to render a water layer provided by the HERE Vector Tile API. For more information about layers available within the Vector Tile API, refer to the Layers section in the REST API documentation.
sources:
    omv:
        type: OMV
# global description of the map, in this example
# the map background color is white
scene:
    background:
        color: [1.000, 1.000, 1.000, 1.00]

# section contains the style information for the layers
# that are present on the map
layers:
    # user defined name of the rendering layer
    water_areas:
        # the section defines where the rendering layer takes
        # its data from source: omv is mandatory for the Vector Tile API
        # layer: water specifies what vector layer is taken
        # for the rendering see REST API documentation for the
        # list of available layers.
        data: {source: omv, layer: water}
        # section defines how to render the layer
        draw:
            polygons:
                order: 1 # z-order of the layer
                color: [0.055, 0.604, 0.914, 1.00]
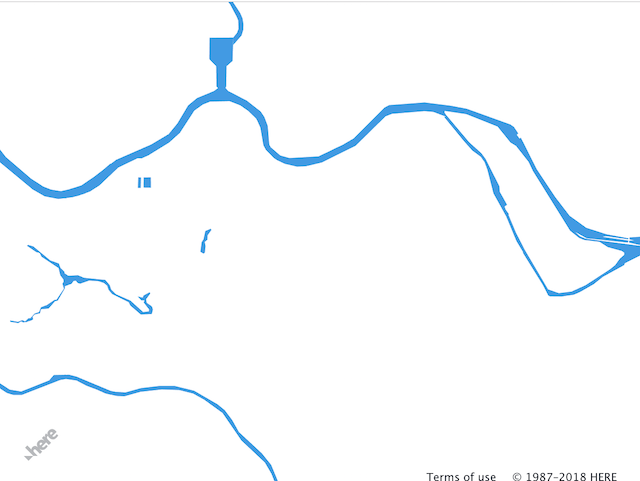
The style above defines the map background color. The style named water_areas defines how to render the data from the vector tile's water layer. You can set the style on the existing Maps API for JavaScript OMV layer as follows.
var style = `
sources:
    omv:
        type: OMV
# global description of the map, in this example
# the map background color is white
scene:
    background:
        color: [1.000, 1.000, 1.000, 1.00]

# section contains the style information for the layers
# that are present on the map
layers:
    # user defined name of the rendering layer
    water_areas:
        # the section defines where the rendering layer takes
        # its data from source: omv is mandatory for the Vector Tile API
        # layer: water specifies what vector layer is taken
        # for the rendering see REST API documentation for the
        # list of available layers.
        data: {source: omv, layer: water}
        # section defines how to render the layer
        draw:
            polygons:
                order: 1 # z-order of the layer
                color: [0.055, 0.604, 0.914, 1.00]
`;

// provided that map was instantiated with the vector layer
// as a base layer
var baseLayer = map.getBaseLayer();
baseLayer.getProvider().setStyle(new H.map.Style(style));
The image below shows the result.
Default styles
In the previous section, the polygon style was used to render waterways. In addition, HERE Maps API for JavaScript provides the following styles for rendering lines, points and text:
-
points- point geometry in the geo space (ex. road shields, POI icons etc.) -
lines- line geometry (ex. road networks, railroads, ferries etc.) -
polygons- polygon that covers a specific geographical area (ex. landuse, waterways, building footprints) -
text- text for the geometry (ex. road labels, building numbers, city names etc.)
Building on the previous example, you can add a simple road network representation to the style. Previously, the polygons style was used for waterways. In the following example, lines must be used to render road networks:
sources:
    omv:
        type: OMV
# global description of the map, in this example
# the map background color is white
scene:
    background:
        color: [1.000, 1.000, 1.000, 1.00]

# section contains the style information for the layers
# that are present on the map
layers:
    # user defined name of the rendering layer
    water_areas:
        # the section defines where the rendering layer takes
        # its data from source: omv is mandatory for the Vector Tile API
        # layer: water specifies what vector layer is taken
        # for the rendering see REST API documentation for the
        # list of available layers.
        data: {source: omv, layer: water}
        # section defines how to render the layer
        draw:
            polygons:
                order: 1 # z-order of the layer
                color: [0.055, 0.604, 0.914, 1.00]
    road:
        data: {source: omv, layer: roads}
        draw:
            lines:
                order: 2
                color: [0.561, 0.561, 0.561, 1.00]
                width: 15
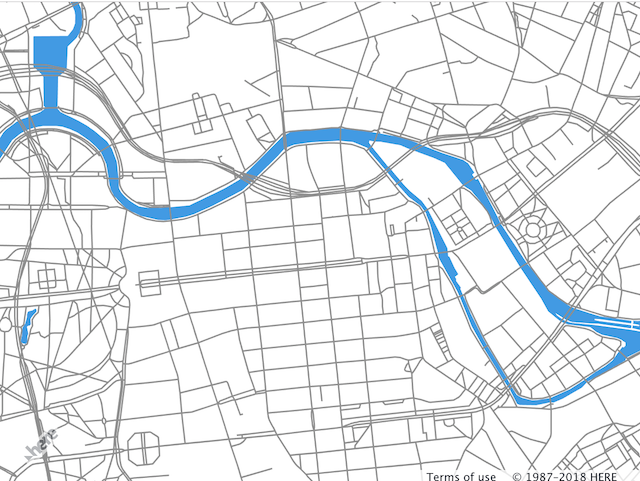
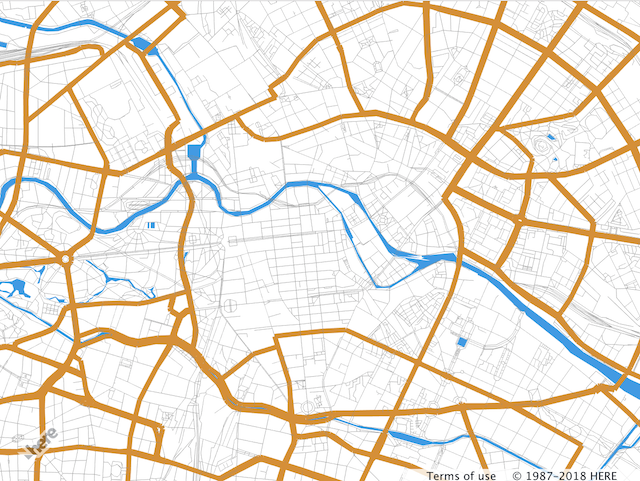
In the example above, the section roads is added. This section uses the roads vector tile data layer specifying the line color and width. If the style template literal is replaced in the JavaScript snippet above, the code produces the following result:
Note
The color can be defined in the following formats:
- CSS named colors
- [r, g, b, a] - array that contains RGBA values in the range 0...1
- '#RRGGBB' - RGB hex string
- rgb(R, G, B) - CSS rgb color in the range 0...255 or 0%...100%
- rgba(R, G, B, A) - CSS rgb color in the range 0...255 and alpha channel in the range 0...1
Map feature filtering
You can filter map features based on the properties associated with them. In the previous section, the road network was colored gray making the map difficult to read. Roads have different weights in the road network and style attributes in the vector tile. For the list of available properties, see HERE Vector Tile API. In the snippet below, the new major_road subsection is added to the road section. This subsection uses the filter attribute to narrow down map features.
sources:
    omv:
        type: OMV
# global description of the map, in this example
# the map background color is white
scene:
    background:
        color: [1.000, 1.000, 1.000, 1.00]

# section contains the style information for the layers
# that are present on the map
layers:
    # user defined name of the rendering layer
    water_areas:
        # the section defines where the rendering layer takes
        # its data from source: omv is mandatory for the Vector Tile API
        # layer: water specifies what vector layer is taken
        # for the rendering see REST API documentation for the
        # list of available layers.
        data: {source: omv, layer: water}
        # section defines how to render the layer
        draw:
            polygons:
                order: 1 # z-order of the layer
                color: [0.055, 0.604, 0.914, 1.00]
    road:
        data: {source: omv, layer: roads}
        draw:
            lines:
                order: 2
                color: [0.561, 0.561, 0.561, 1.00]
                # the width is set in the world meters
                width: 15
        major_road:
            # the filter section narrows down to what features of the
            # data layer the style must be applied to
            filter:
                kind: 'major_road'
            draw:
                lines:
                    color: [0.882, 0.553, 0.086, 1.00]
                    # the width is set in the screen pixels
                    width: 5px
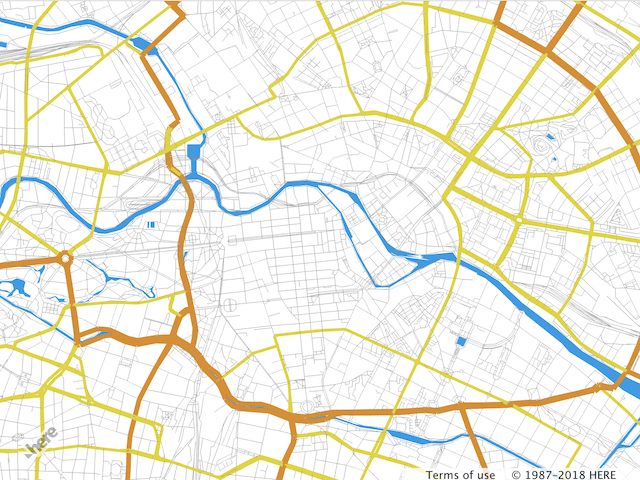
After the style is applied, major roads on the map are rendered with line colors and widths distinct from the rest of the road network.
Note
Line width can be defined in either screen pixels or meters. When defined in screen pixels, line width remains the same for all zoom levels.
You can add specific rules to the filter to get fine map presentation control. When several properties are used in the filter, they are combined using the logical AND. In the example below, the new section major_road_tertiary is added. In this section, roads for which the kind_detail attribute is set to "tertiary" are styled with a different width and colored yellow. Note that the original major_road filter was also changed and narrowed down to "secondary".
sources:
    omv:
        type: OMV
# global description of the map, in this example
# the map background color is white
scene:
    background:
        color: [1.000, 1.000, 1.000, 1.00]

# section contains the style information for the layers
# that are present on the map
layers:
    # user defined name of the rendering layer
    water_areas:
        # the section defines where the rendering layer takes
        # its data from source: omv is mandatory for the Vector Tile API
        # layer: water specifies what vector layer is taken
        # for the rendering see REST API documentation for the
        # list of available layers.
        data: {source: omv, layer: water}
        # section defines how to render the layer
        draw:
            polygons:
                order: 1 # z-order of the layer
                color: [0.055, 0.604, 0.914, 1.00]
    road:
        data: {source: omv, layer: roads}
        draw:
            lines:
                order: 2
                color: [0.561, 0.561, 0.561, 1.00]
                # the width is set in the world meters
                width: 15
        major_road:
            # the filter section narrows down to what features of the
            # data layer the style must be applied to
            filter:
                kind: 'major_road'
                kind_detail: 'secondary'
            draw:
                lines:
                    color: [0.882, 0.553, 0.086, 1.00]
                    # the width is set in the screen pixels
                    width: 5px
        major_road_tertiary:
            filter:
                kind: 'major_road'
                kind_detail: 'tertiary'
            draw:
                lines:
                    color: [0.882, 0.835, 0.086, 1.00]
                    width: 3px
The resulting map will have three different road types rendered: gray as a default color, brown for the secondary roads, and yellow for the tertiary roads.
You can also change styles by using nesting. The following snippet adds specific rules for tunnel rendering on secondary roads.
Note
If a style is nested, all style properties are inherited from the parent.
sources:
    omv:
        type: OMV
# global description of the map, in this example
# the map background color is white
scene:
    background:
        color: [1.000, 1.000, 1.000, 1.00]

# section contains the style information for the layers
# that are present on the map
layers:
    # user defined name of the rendering layer
    water_areas:
        # the section defines where the rendering layer takes
        # its data from source: omv is mandatory for the Vector Tile API
        # layer: water specifies what vector layer is taken
        # for the rendering see REST API documentation for the
        # list of available layers.
        data: {source: omv, layer: water}
        # section defines how to render the layer
        draw:
            polygons:
                order: 1 # z-order of the layer
                color: [0.055, 0.604, 0.914, 1.00]
    road:
        data: {source: omv, layer: roads}
        draw:
            lines:
                order: 2
                color: [0.561, 0.561, 0.561, 1.00]
                # the width is set in the world meters
                width: 15
        major_road:
            # the filter section narrows down to what features of the
            # data layer the style must be applied to
            filter:
                kind: 'major_road'
                kind_detail: 'primary'
            draw:
                lines:
                    color: [0.882, 0.553, 0.086, 1.00]
                    # the width is set in the screen pixels
                    width: 5px
            tunnel:
                # the filter adds more specific rules to the
                # tunnel rendering
                filter:
                    is_tunnel: true
                draw:
                    lines:
                        color: [0.192, 0.882, 0.086, 1.00]
        major_road_tertiary:
            filter:
                kind: 'major_road'
                kind_detail: 'tertiary'
            draw:
                lines:
                    color: [0.882, 0.835, 0.086, 1.00]
                    width: 3px
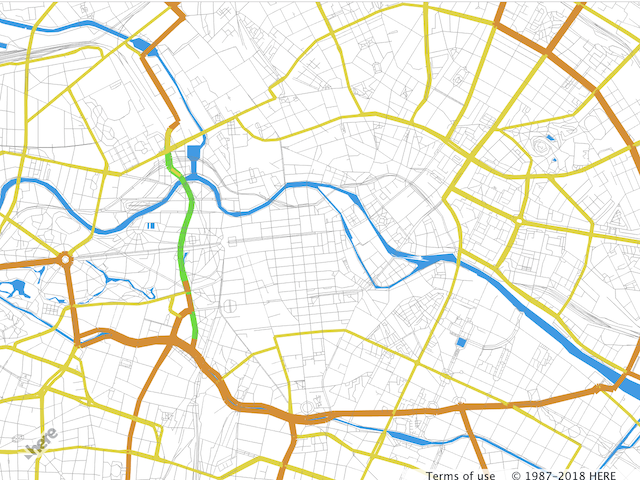
The tunnel subsection from the YAML configuration above changes secondary road tunnel color. See the image below.
Dashed lines
Map features, such as country borders, railroads, and ferry lines, require dashed lines. The lines style provides an easy way to render a dashed line. The property dash contains an array of numbers describing the dash pattern. The behavior of this property is similar to that of the segments element in the HTML5 Canvas setLineDash. The following example adds a specific rule to draw the railroads as dashed lines.
rail:
    filter:
        kind: 'rail'
    draw:
        lines:
            # define the dash period
            dash: [3, 3]
            # dash foreground color
            color: '#FFFFFF'
            # dash background color
            dash_background_color: '#FFAAAA'
            width: 8px
            # outline of the line
            outline:
                color: '#FFAAAA'
                width: .5px
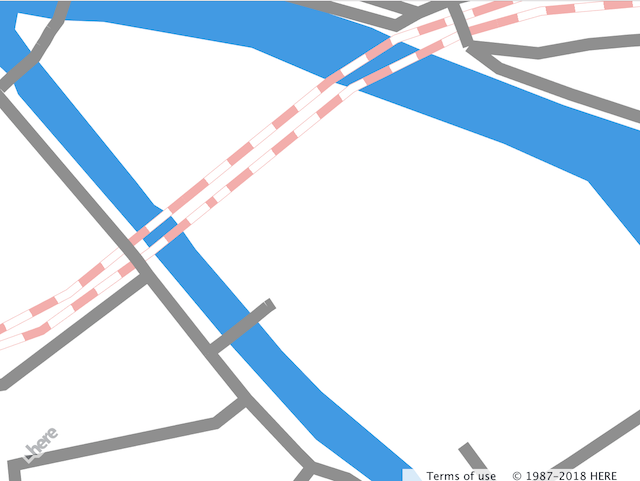
When the snippet above is added to the road section of the style configuration from the previous example, railroads will appear dashed pink as shown on the image below.
See also: