- 製品 製品ロケーションサービス
ジオフェンスからカスタム ルート検索まで、ロケーションに関する複雑な課題を解決します
プラットフォームロケーションを中心としたソリューションの構築、データ交換、可視化を実現するクラウド環境
トラッキングとポジショニング屋内または屋外での人やデバイスの高速かつ正確なトラッキングとポジショニング
API および SDK使いやすく、拡張性が高く、柔軟性に優れたツールで迅速に作業を開始できます
開発者エコシステムお気に入りの開発者プラットフォーム エコシステムでロケーションサービスにアクセスできます
- ドキュメント ドキュメント概要 概要サービス サービスアプリケーション アプリケーションSDKおよび開発ツール SDKおよび開発ツールコンテンツ コンテンツHERE Studio HERE StudioHERE Workspace HERE WorkspaceHERE Marketplace HERE Marketplaceプラットフォーム基盤とポリシーに関するドキュメントプラットフォーム基盤とポリシーに関するドキュメント
- 価格
- リソース リソースチュートリアル チュートリアル例 例ブログとリリースの公開 ブログとリリースの公開変更履歴 変更履歴開発者向けニュースレター 開発者向けニュースレターナレッジベース ナレッジベースフィーチャー 一覧フィーチャー 一覧サポートプラン サポートプランシステムステータス システムステータスロケーションサービスのカバレッジ情報ロケーションサービスのカバレッジ情報学習向けのサンプルマップデータ学習向けのサンプルマップデータ
- ヘルプ
視覚化
HERE インスペクタ
HERE インスペクタパッケージを使用して、 Jupyter ノートブック内のデータを視覚化できます。 インスペクタを使用すると、 HERE platform などのさまざまなソースからのデータを表示できます。 複数のバックエンドをサポートするように設計されたインターフェイスを提供します。 現在サポートされているバックエンドは次のとおりです。
注 : この表示で使用されるマップウィジェット は、 HERE マップサービスによって提供されるデフォルトのウィジェット です。 ウィジェット を使用するには、 HERE API キー で環境変数「 LS_API_KEY 」が設定されていることを確認してください。 また、ズーム、中央揃え、ベースマップ、テーマ、色などのカスタムスタイル設定オプションは、現在 Kepler.GL ライブラリ ではサポートされていません。
次の機能があります。
- インタラクティブマップを表示します
- ベースマップを設定します
- レイヤーを追加します
- 中央揃えとズーム
- インタラクティブなチャートを表示します
- シンプルなプログラマティックインターフェイス
- ヒートマップ、コールズ、マーカー、クラスタリング、およびスタイリングの表示をサポートします
- 対話型アプリケーションの UI コントロール
サポートされているデータ形式 :
基本的な表示
インスペクターの最も簡単な使用方法は、 inspect Jupyter ノートブック内の地理参照情報を 1 行で即座に視覚化する関数を呼び出すことです。
単一のデータセットを検査します
注 : 特定のマップウィジェット を使用するに は、適切なinspector_classオプションとapi_keyオプションを指定する必要があります。 たとえば、ピリーフレットマップウィジェット を使用 するには、options.inspector_class = IpyleafletInspectorおよびoptions.api_key = Noneを設定します。 同様 に、 HERE マップウィジェットまたは Kepler.GL マップウィジェットを使用するには、ウィジェットの要件に応じて、options.inspector_class = HEREMapInspectorまたはoptions.inspector_class = KeplerInspectorをそれぞれ設定し、 API_KEY を設定します。
HERE 地図ウィジェット
import json
from here.inspector import inspect

# Dataset type = GeoJSON file
# This file contains polygon features describing neighborhood boundaries in Chicago
with open('sample_datasets/neighborhood_boundaries.geojson') as f:
    area_boundaries = json.load(f)
#By default if no inspector class is set , sdk will take HERE Map widget for map visualization.
#user can manually set it as follows:-
from here.inspector import options,HEREMapInspector
options.inspector_class = HEREMapInspector
options.api_key = 'Your actual HERE API key'

inspect(area_boundaries)
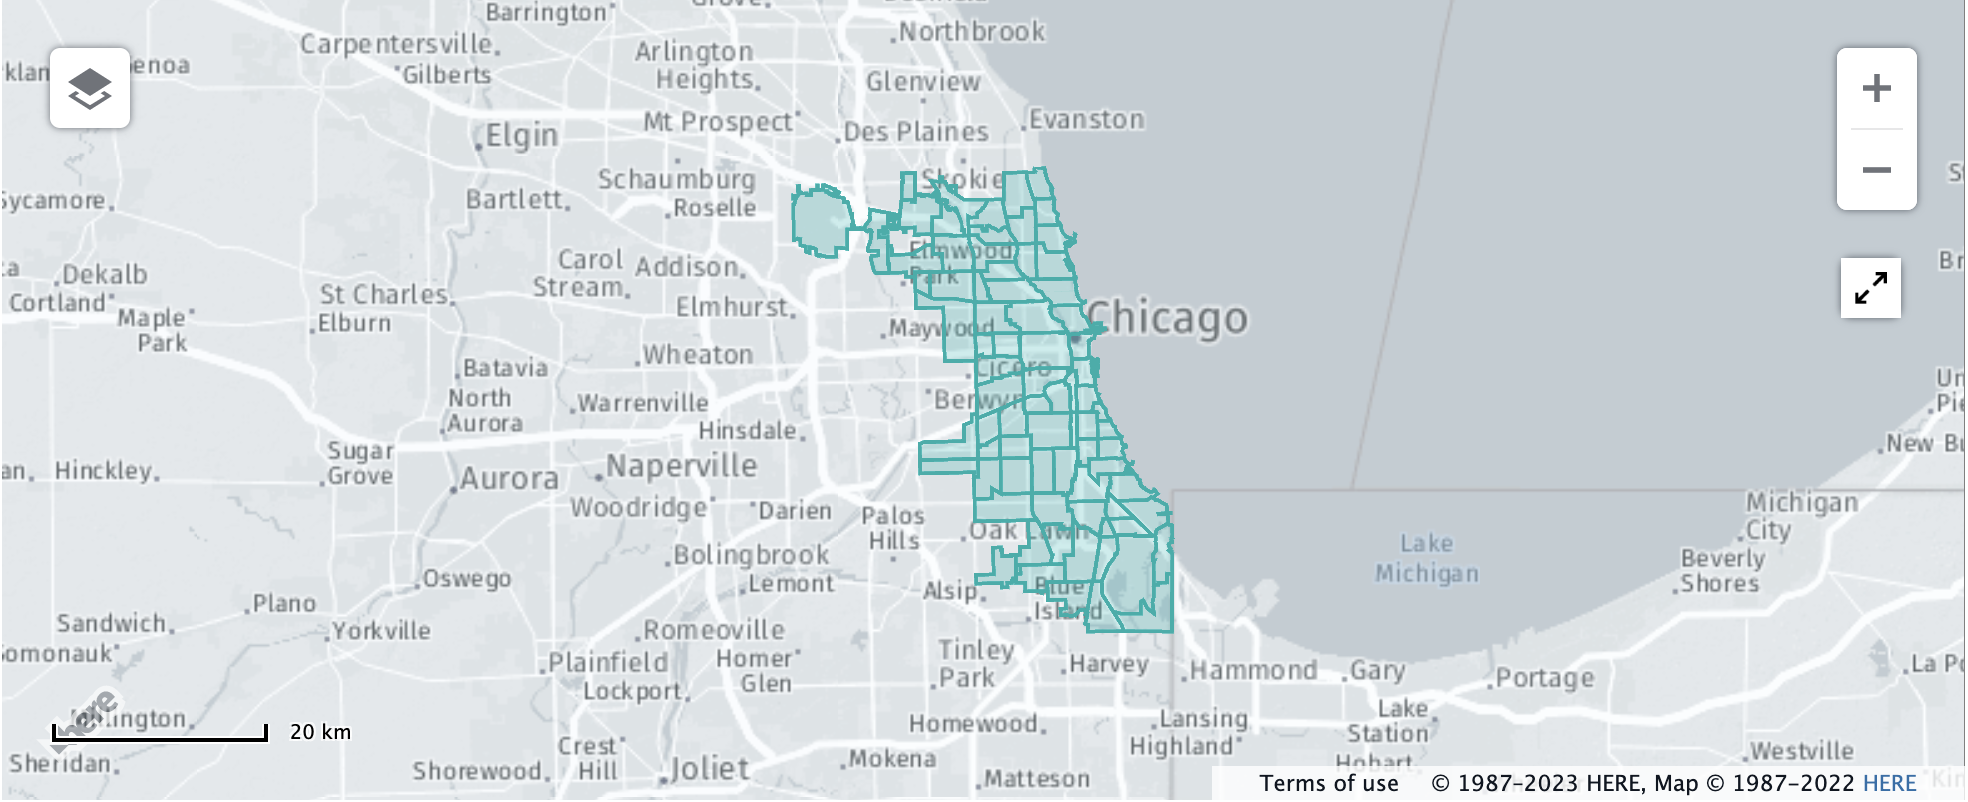
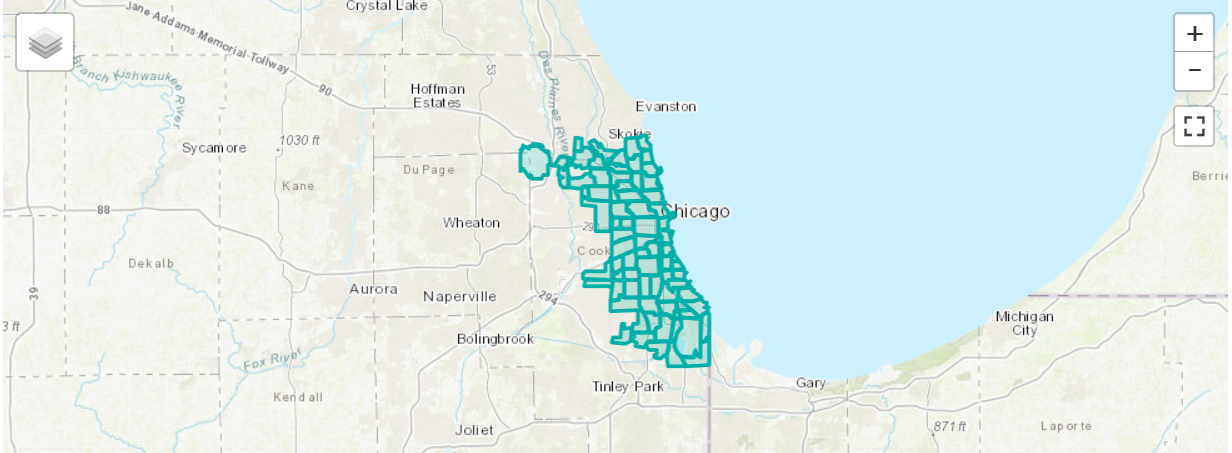
イピリーフレットウィジェット
import json
from here.inspector import inspect

# Dataset type = GeoJSON file
# This file contains polygon features describing neighborhood boundaries in Chicago
with open('sample_datasets/neighborhood_boundaries.geojson') as f:
    area_boundaries = json.load(f)

from here.inspector import options,IpyleafletInspector
options.inspector_class = IpyleafletInspector
options.api_key = None

inspect(area_boundaries)
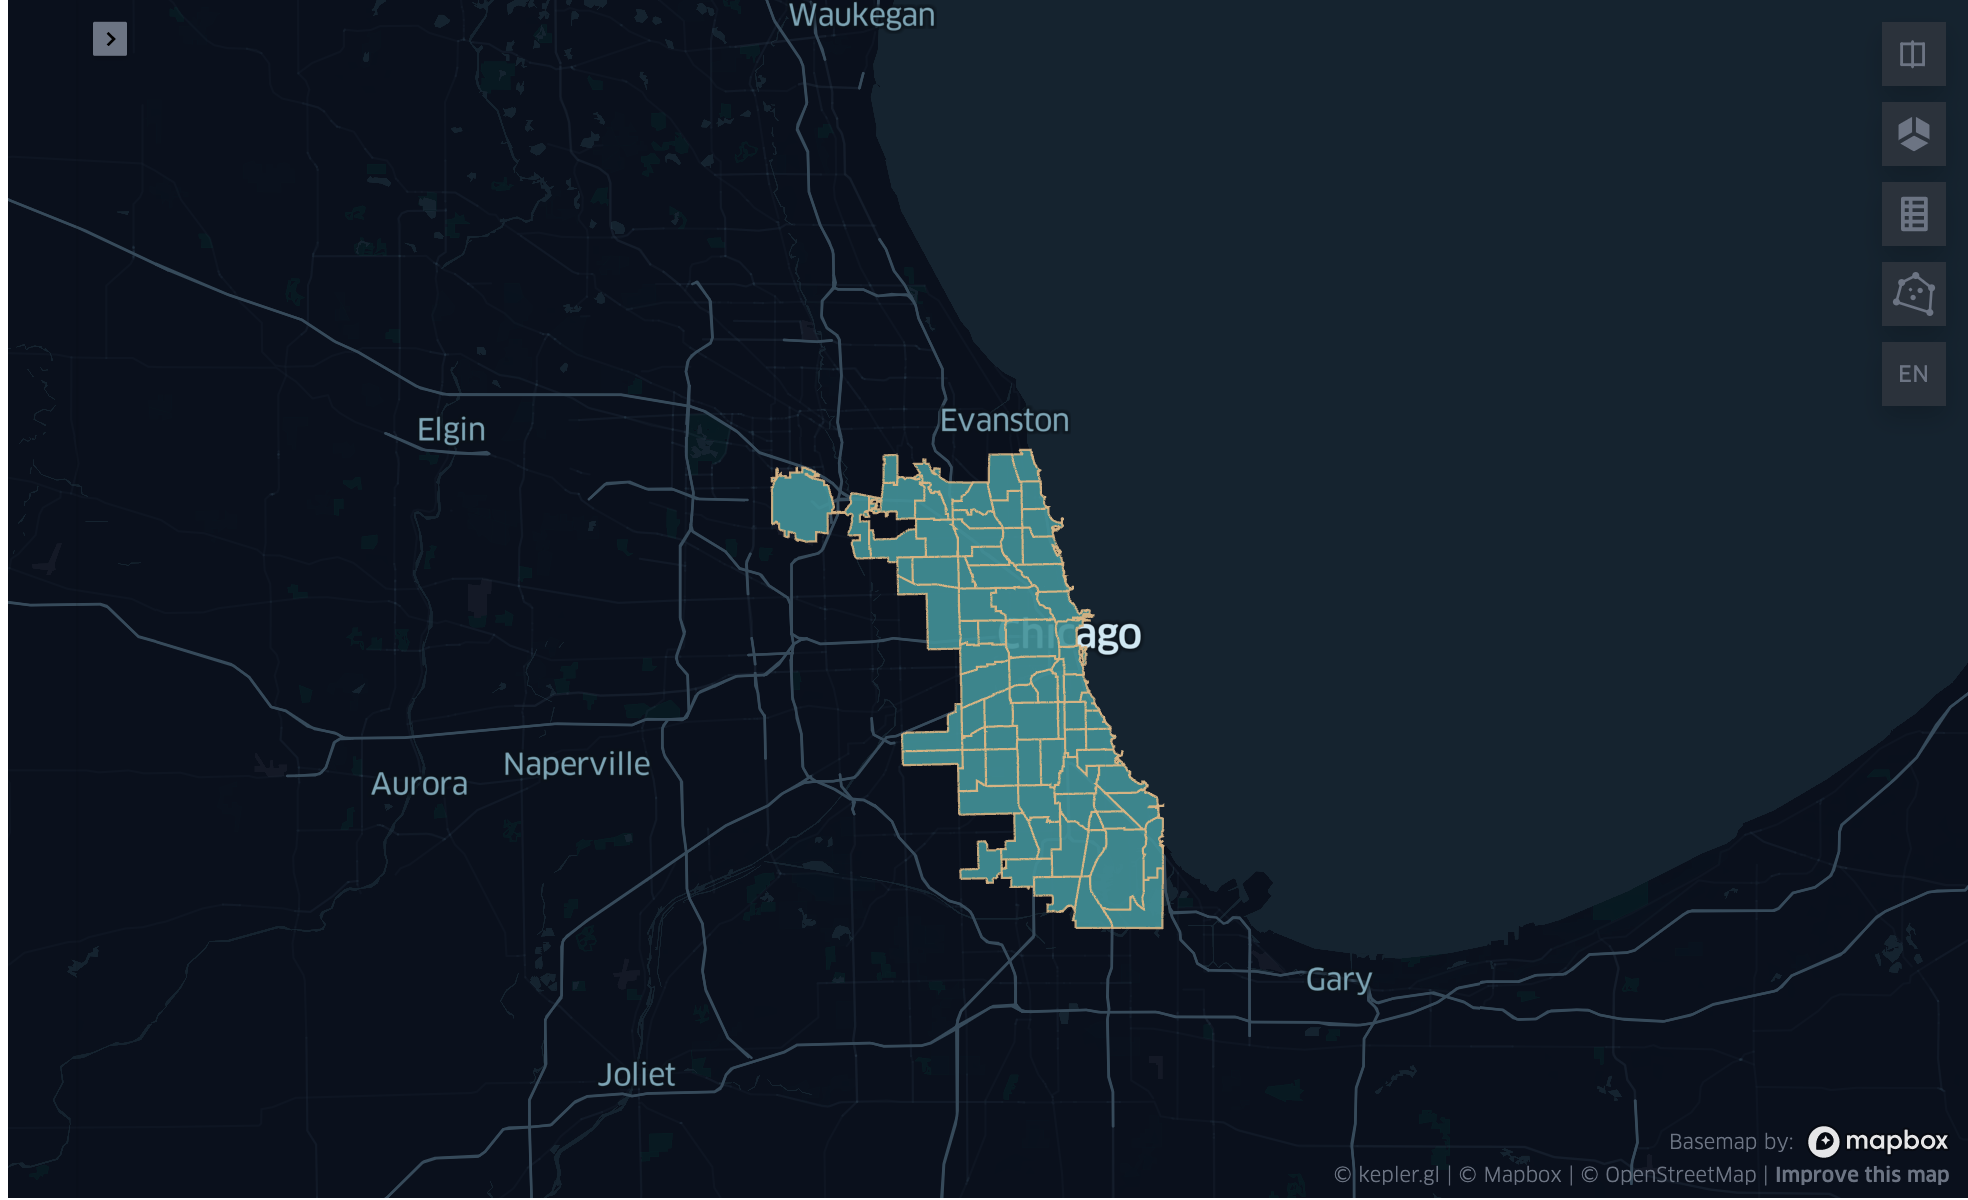
Kepler ウィジェット
import json
from here.inspector import inspect

# Dataset type = GeoJSON file
# This file contains polygon features describing neighborhood boundaries in Chicago
with open('sample_datasets/neighborhood_boundaries.geojson') as f:
    area_boundaries = json.load(f)

from here.inspector import options,KeplerInspector
options.inspector_class = KeplerInspector
options.api_key = None

inspect(area_boundaries)
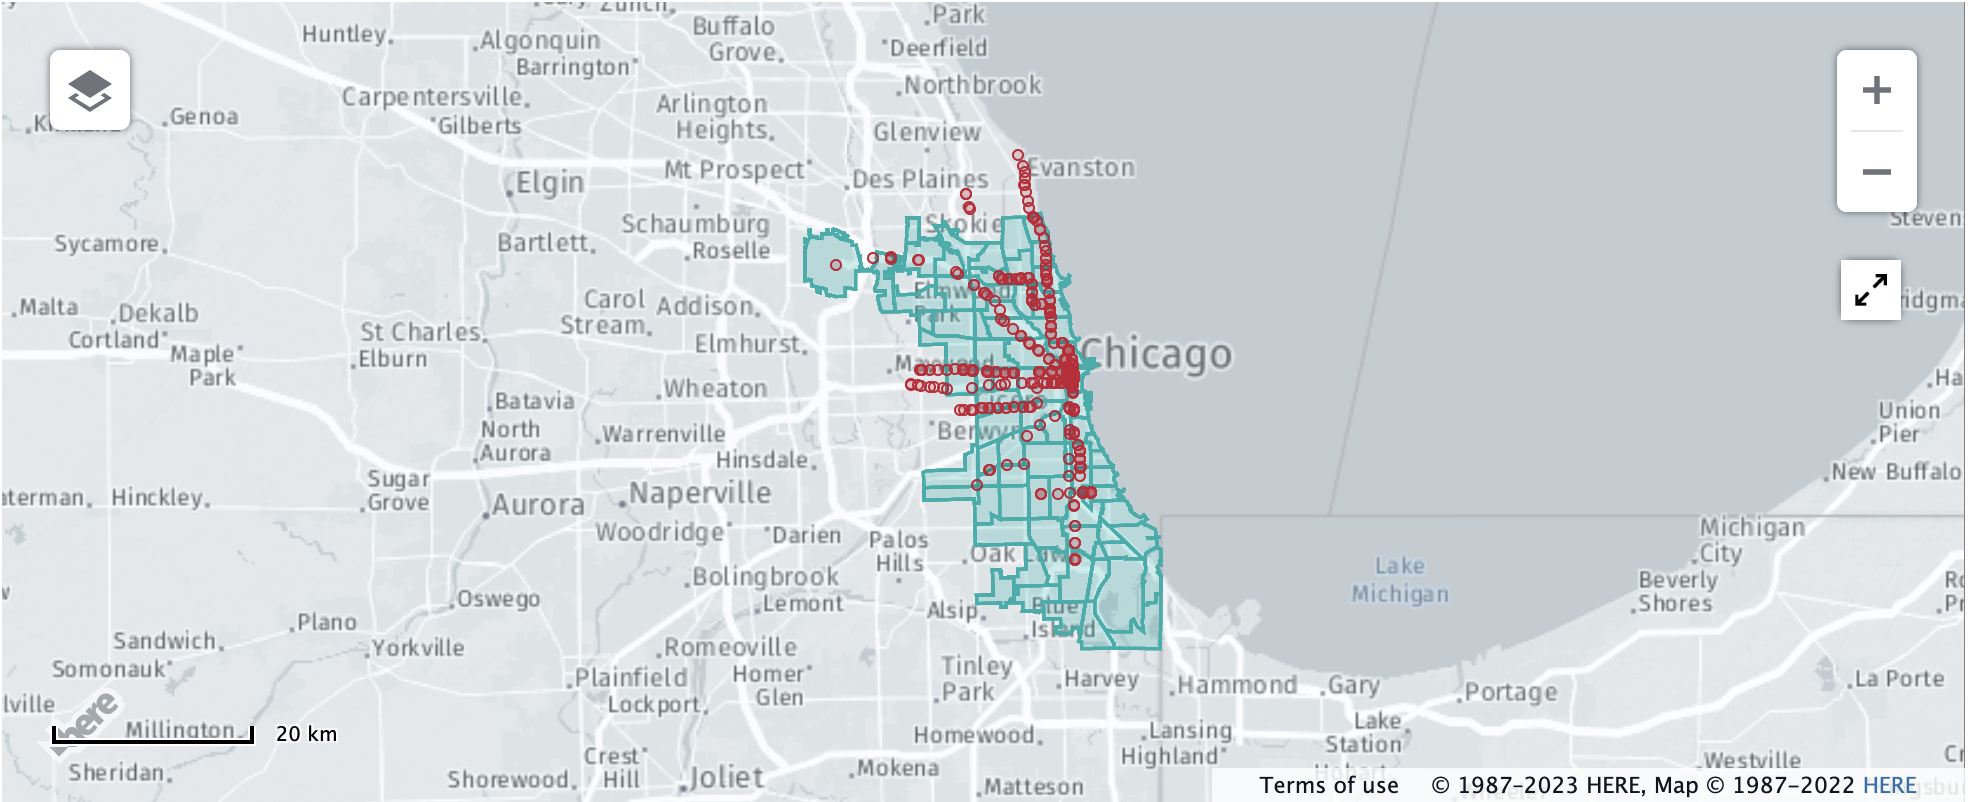
複数のデータセットを検査します
import geopandas as gpd

# Dataset type = GeoDataFrame
# This dataframe contains all Chicago Transit Authority rail station entrance locations
cta_df = gpd.read_file('sample_datasets/cta_entrances.geojson')
cta_df.head()
| 名前 | 代理店 | 直線 | 形状 | |
|---|---|---|---|---|
| 0 | 18 | CTA | ピンクの線 | ポイント (-87.669144 41.857849) |
| 1 | 35 階建てのアーチャー | CTA | オレンジ色の線 | ポイント (-87.680632 41.829274) |
| 2 | 95 歳のお子様は Dan Ryan です | CTA | 赤い線 | ポイント (-87.62441 41.722729) |
| 3 | アダムス / ワバッシュ | CTA | 茶、紫、オレンジ、ピンク、緑の線 | ポイント (-87.625997 41.879715) |
| 4 | アディソン | CTA | 青い線 | ポイント (-87.718406 41.946604) |
HERE 地図ウィジェット
from here.inspector import options,HEREMapInspector
options.inspector_class = HEREMapInspector
options.api_key = 'Your actual HERE API key'

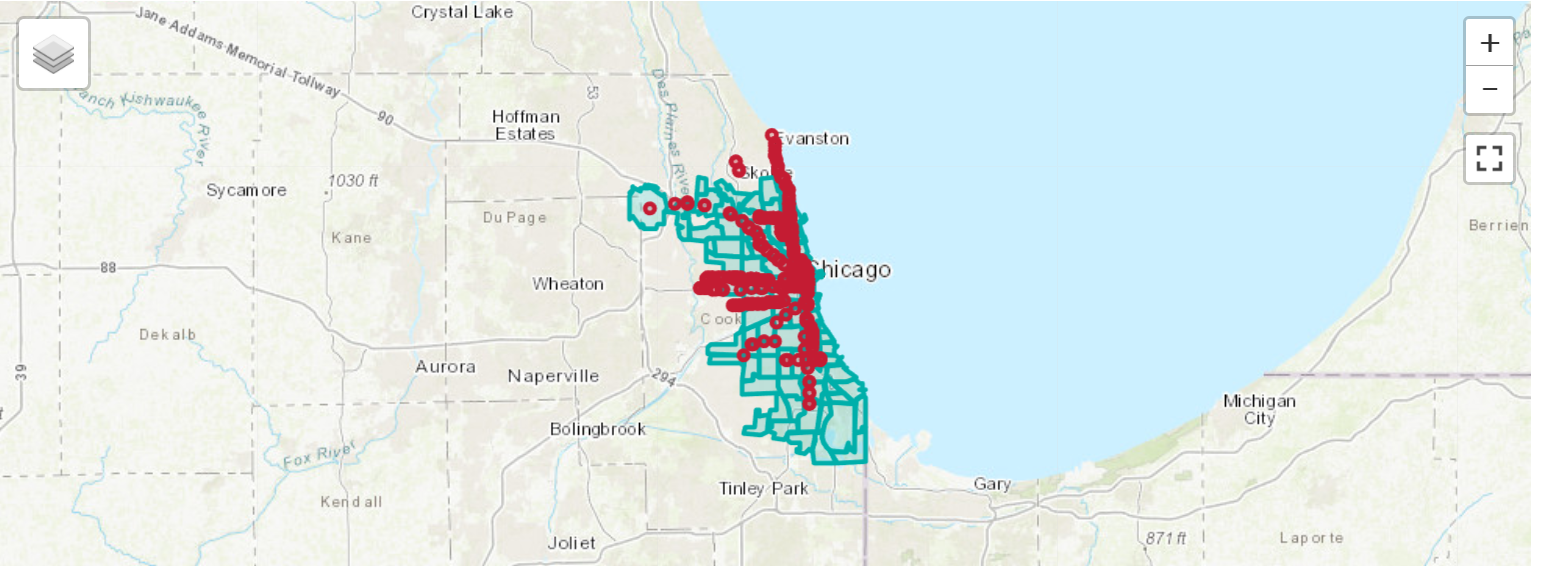
inspect(layers={'Neighborhoods': area_boundaries, 'Stations': cta_df})
イピリーフレットウィジェット
from here.inspector import options,IpyleafletInspector
options.inspector_class = IpyleafletInspector
options.api_key = None

inspect(layers={'Neighborhoods': area_boundaries, 'Stations': cta_df})
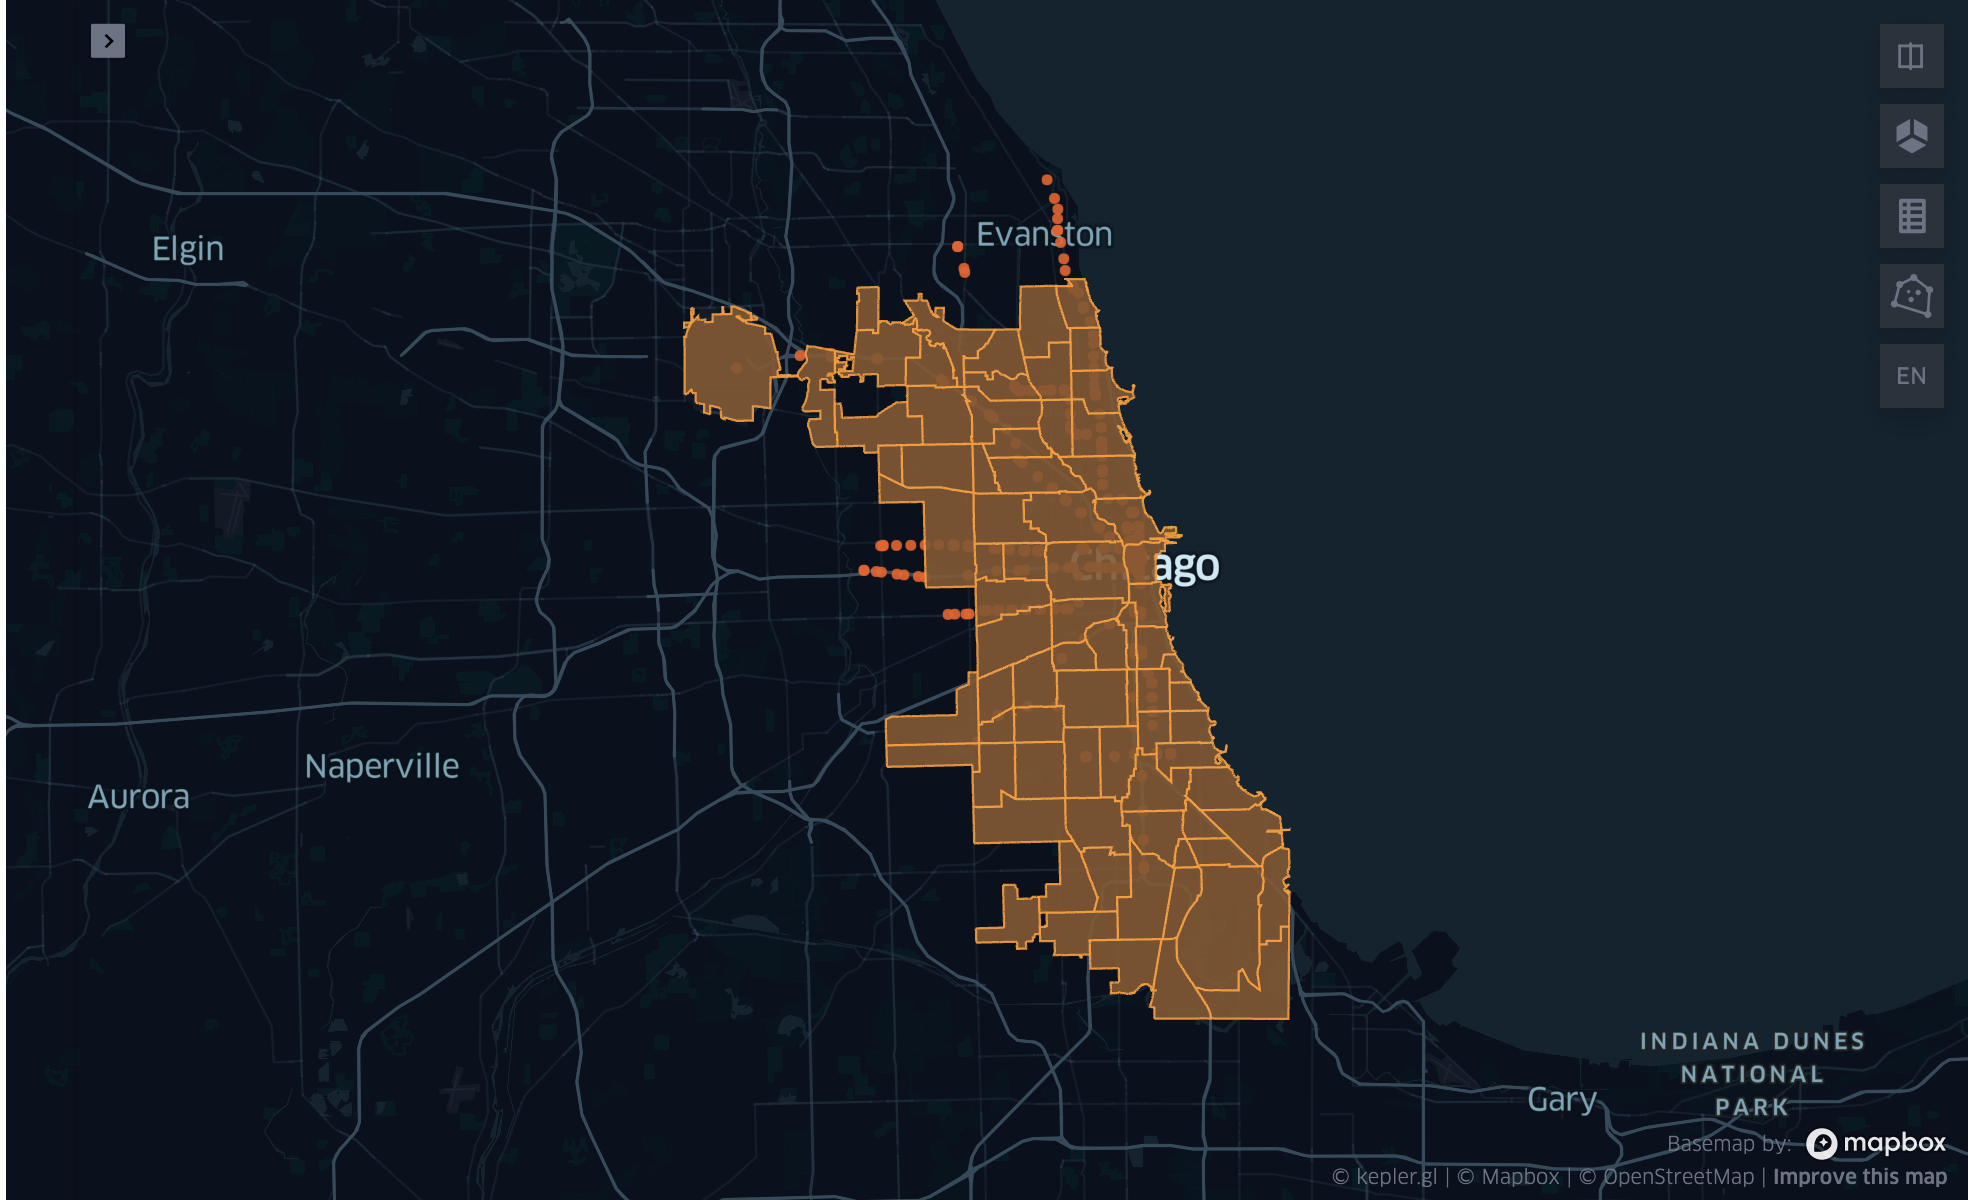
Kepler ウィジェット
from here.inspector import options,KeplerInspector
options.inspector_class = KeplerInspector
options.api_key = None

inspect(layers={'Neighborhoods': area_boundaries, 'Stations': cta_df})
カスタムスタイルは、追加 layers_style のパラメーターを渡すか、単純にタプルを渡すことで指定できます。
注意 :- カスタムスタイル設定機能は、 HERE マップおよび Ipyleaflet ウィジェット でのみ利用できます。
from here.inspector import Color

inspect(layers=[
    ('Neighborhoods', area_boundaries, Color.AQUA),
    ('Stations', cta_df, Color.RED)
])
高度なスタイリング
Inspect このインターフェイスには、次の基本設定オプションがあります。
- 地図 テーマを設定しています
- ベースマップを選択しています
- 表示 の中心点とズーム レベルを設定しています
- カスタム カラー
サポートされているレンダリングバックエンドでは、高度なスタイル設定機能を使用できます(HERE Map ウィジェット for Jupyter 、 ipyleaflet 、および)
- Kepler ウィジェット を参照)。
Inspector.backendこの機能を使用すると、レンダリングバックエンドのすべての拡張機能にアクセスでき、無制限のカスタマイズが可能になります。
すべて の視覚化オプションの包括的な例については、「 Tutorial Notebooks 」ExploreInspector_ipyleaflet.ipynbExploreInspector_kepler.ipynbおよびExploreInspector_HereMapWidgetForJupyter.ipynb「」を参照してください。