- 製品 製品ロケーションサービス
ジオフェンスからカスタム ルート検索まで、ロケーションに関する複雑な課題を解決します
プラットフォームロケーションを中心としたソリューションの構築、データ交換、可視化を実現するクラウド環境
トラッキングとポジショニング屋内または屋外での人やデバイスの高速かつ正確なトラッキングとポジショニング
API および SDK使いやすく、拡張性が高く、柔軟性に優れたツールで迅速に作業を開始できます
開発者エコシステムお気に入りの開発者プラットフォーム エコシステムでロケーションサービスにアクセスできます
- ドキュメント ドキュメント概要 概要サービス サービスアプリケーション アプリケーションSDKおよび開発ツール SDKおよび開発ツールコンテンツ コンテンツHERE Studio HERE StudioHERE Workspace HERE WorkspaceHERE Marketplace HERE Marketplaceプラットフォーム基盤とポリシーに関するドキュメントプラットフォーム基盤とポリシーに関するドキュメント
- 価格
- リソース リソースチュートリアル チュートリアル例 例ブログとリリースの公開 ブログとリリースの公開変更履歴 変更履歴開発者向けニュースレター 開発者向けニュースレターナレッジベース ナレッジベースフィーチャー 一覧フィーチャー 一覧サポートプラン サポートプランシステムステータス システムステータスロケーションサービスのカバレッジ情報ロケーションサービスのカバレッジ情報学習向けのサンプルマップデータ学習向けのサンプルマップデータ
- ヘルプ
クラスタデータセット
マップに数千のポイントが含まれている可能性がある大きなデータセットを表示する場合、問題が発生する可能性があります。 まず、すべてのポイント ( 「マーカー」とも呼ばれます ) が低いズームレベルで表示されると、パフォーマンスが低下することがあります。 次に、地理的に近い場所にあるマーカーが重なり合い、ズームレベルが低い場合には互いに隠れてしまう可能性があります。
これらの問題に対処するには、クラスタリングを使用します。 クラスタ化には、画面上の互いに近くにある 2 つ以上のポイントを 1 つのクラスタポイントにまとめるアルゴリズムが含まれます。 折りたたまれていない他のすべてのポイントは、 " ノイズポイント " としてマップに表示されたままになります。
次の図は、ノイズポイントを青のドットで示し、クラスタを緑とオレンジのマーカーで示しています。各クラスタには、結合されたデータポイントの累積的なウェイトが表示されています。
以下のセクションでは、イギリスのロンドン の空港を表すデータポイントの簡単で実用的な例を使用して、クラスタデータセットを作成してマップに表示するプロセスを説明します。
- 作業を開始する前に
- クラスタリングを有効にします
- クラスタリングデータセットを作成します
- 地図にクラスタデータを表示します
- クラスタの作成を微調整します
- テーマをカスタマイズします
- マーカーを操作します
- ソースコード
- 次のステップ
作業を開始する前に
-
地図と基本的なインタラクションを使用して Web ページを作成するには、まず、地図のレンダリングを担当する JavaScript コード スニペット を参照する HTML ファイルを作成します。
詳細およびコードサンプルについては 、 Maps API for JavaScript 3.1 を参照してください
-
JavaScript スニペット で、英国のロンドン に地図を中央揃えにし、次
7の例に示すようにズーム レベル をに設定します。// Instantiate (and display) a map: var map = new H.Map( document.getElementById("map"), defaultLayers.vector.normal.map, { zoom: 7, center: { lat: 51.509865, lng: -0.118092 } });
クラスタリングを有効にします
次 の例に示すように、.htmlファイルの<head>セクションにクラスタリングモジュールmapsjs-clustering.jsを含めます。
<!DOCTYPE html>
<html>
<head>
<script type="text/javascript"
src="https://js.api.here.com/v3/3.1/mapsjs-core.js"></script>
<script type="text/javascript"
src="https://js.api.here.com/v3/3.1/mapsjs-service.js"></script>
<script type="text/javascript"
src="https://js.api.here.com/v3/3.1/mapsjs-mapevents.js"></script>
<script type="text/javascript" charset="utf-8"
src="https://js.api.here.com/v3/3.1/mapsjs-clustering.js"></script>
<style>
...
</style>
</head>
クラスタリングデータセットを作成します
yuor JavaScript スニペット 内で、次の例に示すように、マップ上にクラスタとして表示するデータポイントを保存する変数を作成します。
var dataPoints = [];
dataPoints.push(new H.clustering.DataPoint(51.4748, -0.368)); // City Airport (LCY)
dataPoints.push(new H.clustering.DataPoint(51.8897, 0.2629)); // Biggin Hill Airport (BQH)
dataPoints.push(new H.clustering.DataPoint(51.4508, -0.1546)); // Heathrow Airport (LHR)
dataPoints.push(new H.clustering.DataPoint(51.3483, -0.5037)); // Gatwick Airport (LGW)
dataPoints.push(new H.clustering.DataPoint(51.1537, -0.1821)); // Luton Airport (LTN)
dataPoints.push(new H.clustering.DataPoint(51.7588, -0.262)); // Stansted Airport (STN)
この例では、という変数を宣言 dataPoints し、空の配列として初期化します。 次に 、push()メソッドを使用して、新しいH.clustering.DataPointオブジェクトを配列に追加します。 各 H.clustering.DataPoint オブジェクトは、英国のロンドン にある空港の場所を表し、緯度 および経度 の値を使用して作成されます。
地図にクラスタデータを表示します
HERE Maps クラスタリングデータプロバイダおよびレイヤーを初期化します。 次に、データポイントをクラスタ化されたレイヤーとしてマップに追加します。 たとえば、次のコード スニペット を参照してください。
// Create a data provider:
var clusteredDataProvider = new H.clustering.Provider(dataPoints);
// Create a layer that includes the data provider and its data points:
var layer = new H.map.layer.ObjectLayer(clusteredDataProvider);
// Add the layer to the map:
map.addLayer(layer);
このコード H.clustering.Provider は、クラスタリングアルゴリズムを実行するオブジェクトを作成し、画面の密度に応じてデータポイントをグループ化します。 H.map.layer.ObjectLayer このオブジェクトは、マップにクラスタ化されたデータポイントを追加します。
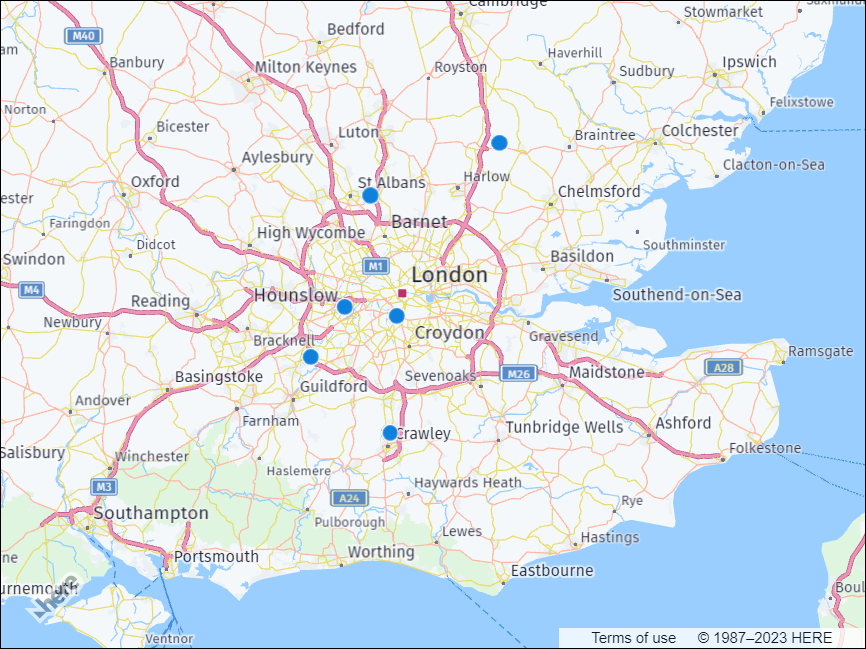
結果: 次の図は、 HERE クラスタリングアルゴリズムが、ズーム レベル に応じてマップ上の空港データセットをクラスタまたは個々のデータポイントとしてレンダリングする方法を示しています。
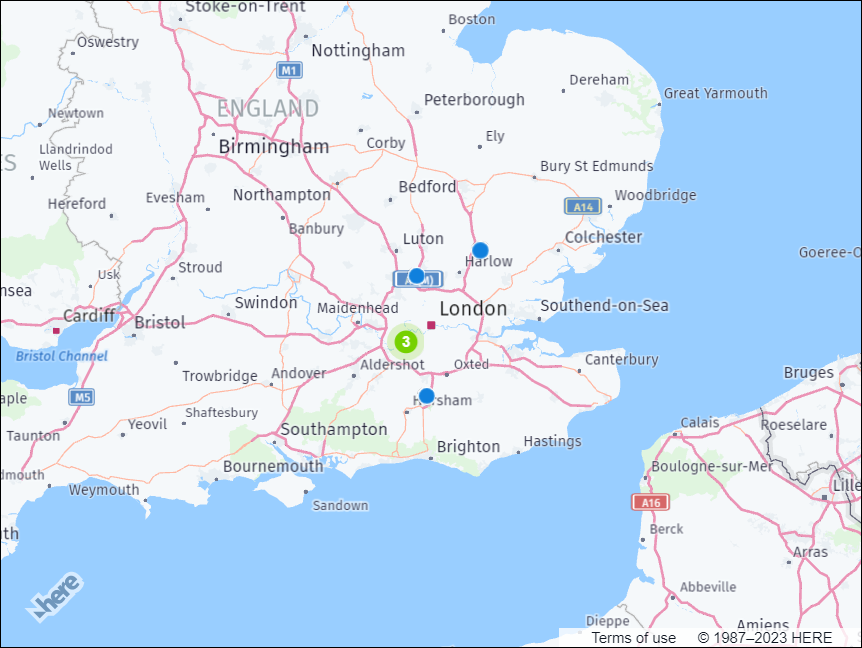
ズームインすると、クラスタが個々のデータポイントに分割されます。
クラスタの作成を微調整します
ユースケース のクラスタリングアルゴリズムをカスタマイズするに H.clustering.Provider は、クラスのパラメータを調整します。
このクラスには、クラスタおよびノイズポイントの視覚的な表現方法、クラスタの一部と見なされるデータポイントの最大半径、およびクラスタを形成するために必要な最小重量を決定するプロパティが含まれています。
ニーズに合わせてクラスタリングの動作を調整するに H.clustering.Provider は、カスタマイズした内容でインスタンスを更新します。 例 :
var clusteredDataProvider = new H.clustering.Provider(dataPoints, {
min: 4,
max: 10,
clusteringOptions: {
eps: 32,
minWeight: 3
}
});
ここで、
minおよびmaxのプロパティはH.clustering.Provider、クラスの設定可能なオプションの一部ではありません。 これらのオプションでは、クラスタリングが発生するズーム レベル 範囲を定義します。-
epsこのプロパティは、データポイントがクラスタの一部と見なされる最大半径を決定します。たとえば、コード例で
epsは、値はに設定32されています。 つまり、 2 つのデータポイントが32マップ上の互いにピクセルの範囲内にある場合、クラスタリングアルゴリズムはそれらのデータポイントを同じクラスタの一部と見なします。 -
minWeightこのプロパティでは、クラスタを形成するために必要な最小重量を決定します。指定した例で は、
minWeightプロパティが3に設定 されています。つまり、重みの合計が少なくとも33 つのデータポイントがクラスタを形成するために必要です。 たとえば、重みがの 3 つのデータポイント1、または重みが2の 2 つのデータポイントと重みがの 1 つのデータポイントがある場合1、それらのデータポイントはまとめてクラスタ化されます。 ただし、それぞれのデータポイントの重みが 2 つだけの場合1、それらのデータポイントは一緒にクラスタ化されません。
テーマをカスタマイズします
地図上では、クラスターとノイズポイントがマーカーで表示されます。 既定では、クラスター化プロバイダは既定のビットマップマーカーテーマを使用します。このテーマには、マップ上にクラスターおよびノイズポイントを表示するためのウェイト情報が含まれています。 ユースケース のマーカーの外観を調整するには、プロバイダを呼び出すときにカスタムテーマを作成し、 theme プロパティの値として設定します。
-
ノイズアイコンに使用する SVG テンプレート を定義します。 次のテンプレート は、緑の円が内側にある SVG 要素で構成されています。
// SVG template to use for noise icons var noiseSvg = '<svg xmlns="http://www.w3.org/2000/svg" height="20px" width="20px"><circle cx="5px" cy="5px" r="5px" fill="green" /></svg>'; -
noiseSvgテンプレート を使用してH.map.Iconオブジェクトを作成します。 アイコンのサイズとアンカーをピクセル単位で指定します。// Create an icon to represent the noise points // Note that same icon will be used for all noise points var noiseIcon = new H.map.Icon(noiseSvg, { size: { w: 20, h: 20 }, anchor: { x: 10, y: 10}, }); -
クラスタアイコンに使用する SVG テンプレート を定義します。 次のテンプレート は、変数を使用して指定された円のサイズと位置を持つ、赤い円が内側にある SVG 要素で構成されています。
// SVG template to use for cluster icons var clusterSvgTemplate = '<svg xmlns="http://www.w3.org/2000/svg" height="{diameter}" width="{diameter}">' + '<circle cx="{radius}px" cy="{radius}px" r="{radius}px" fill="red" />' + '</svg>'; -
H.clustering.Providerオブジェクトを変更して、の配列dataPointsおよびthemeインプリメントをパラメーターとして使用します。// Create a clustered data provider and a theme implementation var clusteredDataProvider = new H.clustering.Provider(dataPoints, { theme: { getClusterPresentation: function(cluster) { // Use cluster weight to change the icon size var weight = cluster.getWeight(), // Calculate circle size radius = weight * 5, diameter = radius * 2, // Replace variables in the icon template svgString = clusterSvgTemplate.replace(/\{radius\}/g, radius).replace(/\{diameter\}/g, diameter); // Create an icon // Note that we create a different icon depending from the weight of the cluster clusterIcon = new H.map.Icon(svgString, { size: {w: diameter, h: diameter}, anchor: {x: radius, y: radius} }), // Create a marker for the cluster clusterMarker = new H.map.Marker(cluster.getPosition(), { icon: clusterIcon, // Set min/max zoom with values from the cluster, otherwise // clusters will be shown at all zoom levels min: cluster.getMinZoom(), max: cluster.getMaxZoom() }); // Bind cluster data to the marker clusterMarker.setData(cluster); return clusterMarker; }, getNoisePresentation: function(noisePoint) { // Create a marker for noise points: var noiseMarker = new H.map.Marker(noisePoint.getPosition(), { icon: noiseIcon, // Use min zoom from a noise point to show it correctly at certain zoom levels min: noisePoint.getMinZoom() }); // Bind noise point data to the marker: noiseMarker.setData(noisePoint); return noiseMarker; } } });themeこの実装では、マップでのクラスタおよびノイズポイントの表示方法を指定します。getClusterPresentation()この関数は、クラスタのウェイトおよび前に定義した SVG テンプレート を使用して、クラスタアイコンのサイズと位置を計算します。 この関数H.map.Markerは、アイコン、最小および最大のズームレベル、マーカーのデータを使用して、クラスタのオブジェクトを作成します。getNoisePresentation()この関数H.map.Markerは、前に定義したものと同じ SVG テンプレート を使用して、各ノイズポイントのオブジェクトを作成し、マーカーのアイコンと最小ズーム レベル を設定します。
結果: 次の図は、データポイントのクラスタリングにカスタムテーマを使用した結果を示しています。 この図では、クラスターマーカーは赤色の円で表され、ノイズポイントは緑色の円で表されています。
マーカーを操作します
マップイベントを使用すると、クラスタおよびノイズポイントを表すマーカー、およびオンデマンドでアクセスクラスタ (H.clustering.ICluster) またはノイズポイント (H.clustering.INoisePoint) のデータを操作できます。
クラスタリングプロバイダで特定のイベントタイプを処理するには、そのタイプのイベントリスナーを追加します。
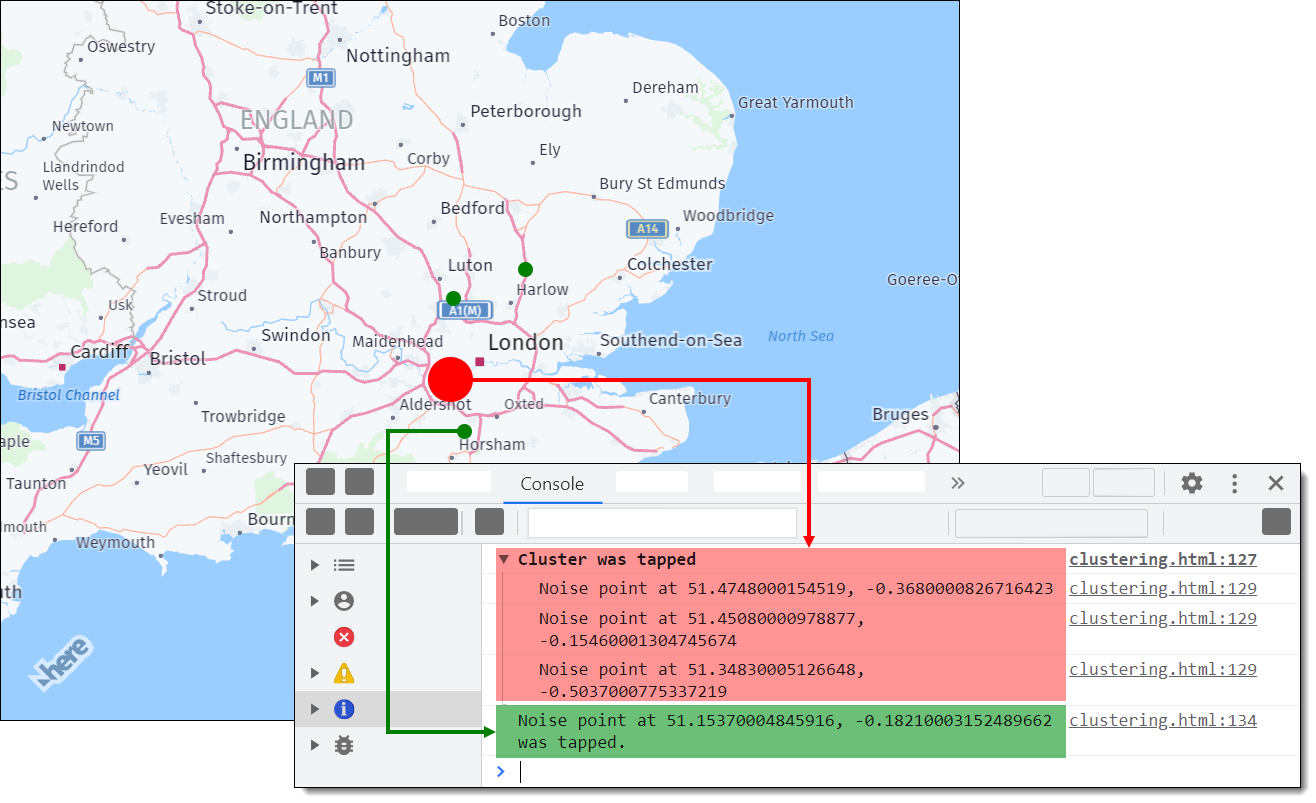
次の例では、マーカーがタップされたことを検出するために、イベントリスナーがクラスタ化されたデータプロバイダに追加されます。 マーカーがタップされると、マーカーの緯度 および経度 が、マーカーのタイプに応じてコンソールに記録されます。
// Add an event listener to the Provider - this listener is called when a marker has been tapped:
clusteredDataProvider.addEventListener('tap', function(event) {
// Get the clicked marker - either a cluster or a noise point:
var marker = event.target;
// Get the marker implementing IResult interface:
var point = marker.getData();
// Is the marker a cluster?
var isCluster = point.isCluster();
if (isCluster) {
// Log all the noise points inside the cluster along with their geographical position:
console.group("Cluster was tapped");
point.forEachDataPoint((dataPoint) => {
console.log("Noise point at " + dataPoint.getPosition().lat + ", " + dataPoint.getPosition().lng);
});
console.groupEnd();
} else {
// We tapped a noise point
console.log("Noise point at " + point.getPosition().lat + ", " + point.getPosition().lng + " was tapped.");
}
}, false);
次の図は、開発者コンソールウィンドウの出力を示しています。
ソースコード
このセクションでは、このチュートリアルで使用したすべての JavaScript コードについて説明します。 このコードでは、マップを設定し、複数のマーカーを追加します。これらのマーカーは、近接度に基づいてクラスタ化されます。 このコードでは、マーカーをクリックしたときの表示方法および動作方法も定義します。また、イベントリスナーを追加して、クリックしたマーカーの緯度 および経度 を記録します。 最後に、このコードでは、マップ上でのパンとズームの既定の対話操作が有効になります。
const platform = new H.service.Platform({
'apikey': 'YOUR API KEY'
});
// Obtain the default map types from the platform object:
const defaultLayers = platform.createDefaultLayers();
// Instantiate (and display) a map:
var map = new H.Map(
 document.getElementById("map"),
 defaultLayers.vector.normal.map, {
    zoom: 7,
    center: { lat: 51.509865, lng: -0.118092 }
});
var dataPoints = [];
dataPoints.push(new H.clustering.DataPoint(51.4748, -0.368)); //London City Airport (LCY)
dataPoints.push(new H.clustering.DataPoint(51.8897, 0.2629)); //London Biggin Hill Airport (BQH)
dataPoints.push(new H.clustering.DataPoint(51.4508, -0.1546)); //London Heathrow Airport (LHR)
dataPoints.push(new H.clustering.DataPoint(51.3483, -0.5037)); //London Gatwick Airport (LGW)
dataPoints.push(new H.clustering.DataPoint(51.1537, -0.1821)); //London Luton Airport (LTN)
dataPoints.push(new H.clustering.DataPoint(51.7588, -0.262)); //London Stansted Airport (STN)
 // SVG template to use for noise icons
 var noiseSvg = '<svg xmlns="http://www.w3.org/2000/svg" height="20px" width="20px"><circle cx="5px" cy="5px" r="5px" fill="green" /></svg>';
 // Create an icon to represent the noise points
 // Note that same icon will be used for all noise points
 var noiseIcon = new H.map.Icon(noiseSvg, {
     size: { w: 20, h: 20 },
     anchor: { x: 10, y: 10},
   });
 // SVG template to use for cluster icons
 var clusterSvgTemplate = '<svg xmlns="http://www.w3.org/2000/svg" height="{diameter}" width="{diameter}">' +
     '<circle cx="{radius}px" cy="{radius}px" r="{radius}px" fill="red" />' +
     '</svg>';
 // Create a clustered data provider and a theme implementation
 var clusteredDataProvider = new H.clustering.Provider(dataPoints, {
     theme: {
     getClusterPresentation: function(cluster) {
         // Use cluster weight to change the icon size
         var weight = cluster.getWeight(),
         // Calculate circle size
         radius = weight * 5,
         diameter = radius * 2,

         // Replace variables in the icon template
         svgString = clusterSvgTemplate.replace(/\{radius\}/g, radius).replace(/\{diameter\}/g, diameter);

         // Create an icon
         // Note that we create a different icon depending from the weight of the cluster
         clusterIcon = new H.map.Icon(svgString, {
             size: {w: diameter, h: diameter},
             anchor: {x: radius, y: radius}
         }),

         // Create a marker for the cluster
         clusterMarker = new H.map.Marker(cluster.getPosition(), {
             icon: clusterIcon,

             // Set min/max zoom with values from the cluster, otherwise
             // clusters will be shown at all zoom levels
             min: cluster.getMinZoom(),
             max: cluster.getMaxZoom()
         });

         // Bind cluster data to the marker
         clusterMarker.setData(cluster);

         return clusterMarker;
     },
     getNoisePresentation: function(noisePoint) {
     // Create a marker for noise points:
     var noiseMarker = new H.map.Marker(noisePoint.getPosition(), {
             icon: noiseIcon,

             // Use min zoom from a noise point to show it correctly at certain zoom levels
             min: noisePoint.getMinZoom()
         });

     // Bind noise point data to the marker:
     noiseMarker.setData(noisePoint);
     return noiseMarker;
     }
 }
 });
// Create a layer that includes the data provider and its data points:
var layer = new H.map.layer.ObjectLayer(clusteredDataProvider);
// Add the layer to the map:
map.addLayer(layer);
// Add an event listener to the Provider - this listener is called when a marker has been tapped:
clusteredDataProvider.addEventListener('tap', function(event) {
    // Get the clicked marker - either a cluster or a noise point:
    var marker = event.target;

    // Get the marker implementing IResult interface:
    var point = marker.getData();

    // Is the marker a cluster?
    var isCluster = point.isCluster();

    if (isCluster) {
    // Log all the noise points inside the cluster along with their geographical position:
    console.group("Cluster was tapped");
    point.forEachDataPoint((dataPoint) => {
        console.log("Noise point at " + dataPoint.getPosition().lat + ", " + dataPoint.getPosition().lng);
    });
    console.groupEnd();
    } else {
    // We tapped a noise point
    console.log("Noise point at " + point.getPosition().lat + ", " + point.getPosition().lng + " was tapped.");
    }
}, false);
// MapEvents enables the event system
// Behavior implements default interactions for pan/zoom (also on mobile touch environments)
const behavior = new H.mapevents.Behavior(new H.mapevents.MapEvents(map));
次のステップ
- 他の Maps API for JavaScript の使用例の詳細について は、例を参照してください。
- Maps API for JavaScript デザインの詳細については 、 API リファレンス を参照してください。