- Products ProductsLocation Services
Solve complex location problems from geofencing to custom routing
PlatformCloud environments for location-centric solution development, data exchange and visualization
Tracking & PositioningFast and accurate tracking and positioning of people and devices, indoors or outdoors
APIs & SDKsEasy to use, scaleable and flexible tools to get going quickly
Developer EcosystemsAccess Location Services on your favorite developer platform ecosystem
- Documentation DocumentationOverview OverviewServices ServicesApplications ApplicationsDevelopment Enablers Development EnablersContent ContentHERE Studio HERE StudioHERE Workspace HERE WorkspaceHERE Marketplace HERE MarketplacePlatform Foundation and Policy Documents Platform Foundation and Policy Documents
- Pricing
- Resources ResourcesTutorials TutorialsExamples ExamplesBlog & Release Announcements Blog & Release AnnouncementsChangelog ChangelogDeveloper Newsletter Developer NewsletterKnowledge Base Knowledge BaseFeature List Feature ListSupport Plans Support PlansSystem Status System StatusLocation Services Coverage Information Location Services Coverage InformationSample Map Data for Students Sample Map Data for Students
- Help
Run a Spark application on the platform
Objectives: Run a simple Spark application on the platform and monitor the application execution.
Complexity: Beginner
Time to complete: 40 min
Prerequisites: Develop a Spark application, Organize your work in projects
This tutorial demonstrates how to run a Spark application developed in the Develop a Spark application tutorial on the platform. It shows how to get information about the execution of the application using Splunk, Spark UI, Grafana, and Platform Billing Page.
The tutorial covers the following topics:
- Configure resources on the platform
- Run Spark application on the platform
- View the execution plan using Spark UI
- Get application logs from Splunk
- Monitor application data using Grafana Dashboard
- Get costs of the execution
Configure resources on the platform
You will run the application in a project. A project is a container for the HERE platform resources you use to build an app, service, or other work product. It can contain resources such as catalogs, pipelines, schemas, and services. The project controls which users, apps, and groups can access the resources in the project. We recommend that you use projects to manage all your platform resources. For more information about projects, see the Manage Projects documentation.
Let's create a project using the OLP CLI:
olp project create {{PROJECT_ID}} {{PROJECT_NAME}}
The OLP CLI should return the following message:
Project {{YOUR_PROJECT_HRN}} has been created.
Save the {{YOUR_PROJECT_HRN}} value to the console variable to simplify command running.
The next step is to create the input and output catalogs in the project we have created before. The --scope parameter is used to specify the project in the OLP CLI.
Let's execute the following commands from the root of the tutorial folder to create input catalogs using exactly the same catalog-configuration.json config file as we have used in the Develop Spark application tutorial:
olp catalog create <catalog-id> <catalog-name> --config catalog-configuration.json --scope YOUR_PROJECT_HRN
The OLP CLI should return the following message:
Catalog YOUR_INPUT_CATALOG_HRN has been created.
Note
If a billing tag is required in your realm, update the config file by adding the billingTags: ["YOUR_BILLING_TAG"] property to the layer section.
The output catalog should be created using the output-catalog-configuration.json. Run the following command from the root of the tutorial folder to create the output catalog:
olp catalog create <catalog-id> <catalog-name> --config output-catalog-configuration.json --scope YOUR_PROJECT_HRN
Note that the output catalog is not used in our application. We need this catalog to replace the OUTPUT_CATALOG_HRN placeholder in the pipeline-config.conf file.
The next step is to configure the source code to use the input catalog we have created before. Replace the INPUT_CATALOG_HRN and OUTPUT_CATALOG_HRN placeholders in the pipeline-config.conf file with the HRNs of the catalogs you created as described above.
The application has to be packaged with all dependencies in a Fat JAR to be deployed on the platform. The Java/Scala SDK provides a platform profile to generate the Fat JAR. The following command uses the profile to generate the Fat JAR.
mvn -Pplatform clean package
The develop-spark-application-<tutorial-version>-platform.jar Fat JAR should be created in the target folder.
Run Spark application on the platform
To run the Spark application on the platform, you need to get familiar with the Pipeline API.
The following image demonstrates the full pipeline deployment flow using the OLP CLI.
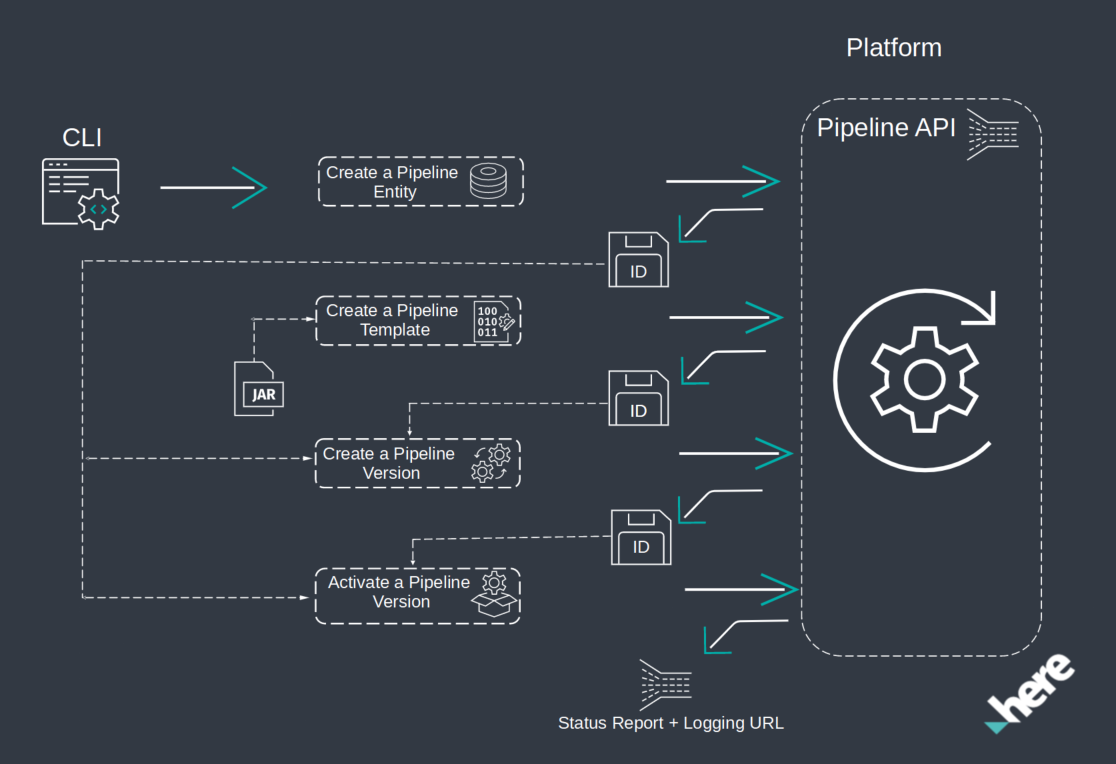
For more information about pipelines, see the Pipelines Developer's Guide.
Now you have all the resources used by the application, and the application configured to use them and prepared to be deployed on the platform. Let's launch the application.
Let's create a pipeline in the project scope using the following OLP CLI command:
olp pipeline create {{PIPELINE_ID}} --scope {{YOUR_PROJECT_HRN}}
The OLP CLI should return the following message:
Pipeline {{YOUR_PIPELINE_ID}} has been created.
The next step is to create a pipeline template. Pipeline templates are provided to aid the user with creating pipelines. These templates contain reusable pipeline definitions - the implementation, as well as the input and output catalog schemas.
To create your own pipeline template, you need to specify the template name, batch runtime environment, since in this tutorial we run a Spark application and use the batch environment on the platform, the Fat JAR created by the mvn package -Pplatform command, the main class, the project that the pipeline belongs to, and input catalog IDs that are expected in the pipeline version configuration.
Let's create a pipeline template by running the following OLP CLI command from the root of the tutorial folder:
Java Application
Scala Application
olp pipeline template create {{TEMPLATE_NAME}} \
batch-3.0 target/develop-spark-application-<version>-platform.jar \
DevelopSparkApplication --input-catalog-ids pipeline-config.conf \
--scope {{YOUR_PROJECT_HRN}}
olp pipeline template create {{TEMPLATE_NAME}} \
batch-3.0 target/develop-spark-application-<version>-platform.jar \
DevelopSparkApplicationScala --input-catalog-ids \
pipeline-config.conf --scope {{YOUR_PROJECT_HRN}}
The OLP CLI should return the following message:
Pipeline template {{YOUR_PIPELINE_TEMPLATE_ID}} has been created.
The next step is to create a pipeline version. Within the Pipelines API, a version of the pipeline is a form of a pipeline and pipeline template.
Let's create a pipeline version in the project scope with the develop-spark billing tag with which you can get the billing and usage data related to your pipeline. For more details, see the Billing and Usage chapter. To add a billing tag to the pipeline version, run the following OLP CLI command from the root of the tutorial folder:
olp pipeline version create test-spark-version {{YOUR_PIPELINE_ID}} {{YOUR_PIPELINE_TEMPLATE_ID}} pipeline-config.conf --billing-tag develop-spark --scope {{YOUR_PROJECT_HRN}}
The OLP CLI should return the following message:
Pipeline {{YOUR_PIPELINE_ID}} has been created.
Once you have created the batch pipeline, pipeline template and pipeline version, you can run the application on the platform by activating the pipeline version.
There are several execution modes available for activating a batch pipeline version: On-demand, Scheduled and Time Schedule. Let's take a closer look at these execution modes. If the --schedule flag was not specified when activating the pipeline version, the On-demand execution mode is used by default. In the On-demand mode, the pipeline enters the Scheduled state and immediately changes to the Running state to attempt to process the specified input data catalogs. When the job is done, the pipeline returns to the Ready state. No further processing is done, even if the input catalogs receive new data. Additional processing must be initiated manually.
If the --schedule flag was specified with the data-change parameter, the Scheduled execution mode is used. In this mode, the pipeline version enters the Scheduled state for a brief period of time and then changes to the Running state to begin processing the existing data in the input catalogs. After the job is completed, it returns to the Scheduled state where it waits for new data to be available in the input catalogs. The pipelines starts when the data is changed, but it can process all data again or only the changed data. It depends on the implementation of the application.
The last execution mode is Time Schedule, which can be selected using the --schedule flag with the time:<cron-expression> parameter, where <cron-expression> is specified in the UNIX cron format.
In this mode, the pipeline enters the Scheduled state and waits for the period of time till it gets executed according to the Time Schedule. Then the pipeline changes to the Running state to begin processing the existing data in the input catalogs. After the job is completed, it returns to the Scheduled state where it waits for the period of time according to the Time Schedule.
This tutorial uses the Scheduled execution mode because the pipeline should run only if new data was uploaded to the catalog.
To activate the pipeline version, run the following OLP CLI command:
olp pipeline version activate {{YOUR_PIPELINE_ID}} {{PIPELINE_VERSION_ID}} --schedule data-change --scope {{YOUR_PROJECT_HRN}}
The OLP CLI should return the following message:
Pipeline version {{YOUR_PIPELINE_ID}} has been activated.
After executing this command, the pipeline does not start but goes to the Scheduled state and waits until the input catalog is updated. You can check the current state of the pipeline on the platform in the Pipeline page or using the following the olp pipeline version show OLP CLI command as we demonstrate below.
Let's upload custom data to the input catalog to trigger the pipeline. To do so, run the following OLP CLI command:
olp catalog layer partition put {{YOUR_CATALOG_HRN}} versioned-layer-custom-data --partitions partition:data/partition_content --scope {{YOUR_PROJECT_HRN}}
The OLP CLI should return the following message:
 100% [======================================================] 1/1 (0:00:00 / 0:00:00)

Partition partition was successfully uploaded.
Once the input catalog is changed, the pipeline is triggered and starts processing data from the input catalog. Note that the process of switching from the Scheduled state to the Running state can take up to 5 minutes.
To check the current state of the pipeline, run the following OLP CLI command:
olp pipeline version show {{YOUR_PIPELINE_ID}} {{PIPELINE_VERSION_ID}} --scope {{YOUR_PROJECT_HRN}}
The OLP CLI should return the information about the specified pipeline version, including its configuration, logging URL, pipeline UI URL. logging URL is the URL of the Splunk logs, and pipeline UI URL is the URL of the Spark UI. Remember the logging and pipeline UI URLs to use in the next chapters.
Details of the {{YOUR_PIPELINE_ID}} pipeline:
ID                       d18282cd-63bb-4640-9f39-a05daa04b5ab
version number           1
pipeline template ID     d03d3762-c02e-48ec-a3d5-38f85de0ce69
output catalog HRN       {{YOUR_OUTPUT_CATALOG}}
state                    running
created                  2022-03-28T11:00:31.932502Z
updated                  2022-03-28T13:38:33.893834Z
highAvailability         false
multi-region enabled     false
input catalogs
    ID                            HRN
    sparkCatalog                  {{YOUR_INPUT_CATALOG}}
logging URL              https://splunk.metrics.platform.here.com/en-US/app/olp-here-test/search?q=search%20index%3Dolp-here-test_common%20namespace%3Dolp-here-test-j-72afe4b1-f5f0-4b77-9d04-79f6c47c71d3
pipeline UI URL          https://eu-west-1.pipelines.platform.here.com/jobs/72afe4b1-f5f0-4b77-9d04-79f6c47c71d3/ui
billing tag              develop-spark
schedule                 data-change
The application is up and running on the platform. Let's check the execution plan and logs and configure monitoring for your application.
View the execution plan using Spark UI
Batch pipelines have a useful tool for monitoring and inspecting batch jobs execution. The Spark framework includes a Web Console that is active for all Spark jobs in the Running state. It is called the Spark UI and can be accessed directly from within the platform or through the olp pipeline version show OLP CLI command . Spark UI is automatically started when a batch pipeline job switches to the Running state. The Spark UI provides insight into batch pipeline processing, including jobs, stages, execution graphs, and logs from the executors.
Starting with the batch-2.1.0 runtime environment, it is also possible to access the Spark UI after the pipeline job has completed its run. The runtime data for a completed job will be accessible via Spark UI for 30 days after completion.
Once you have a running pipeline, you can access the Spark UI. Use the pipeline UI URL from the results of the olp pipeline version show command from the previous chapter.
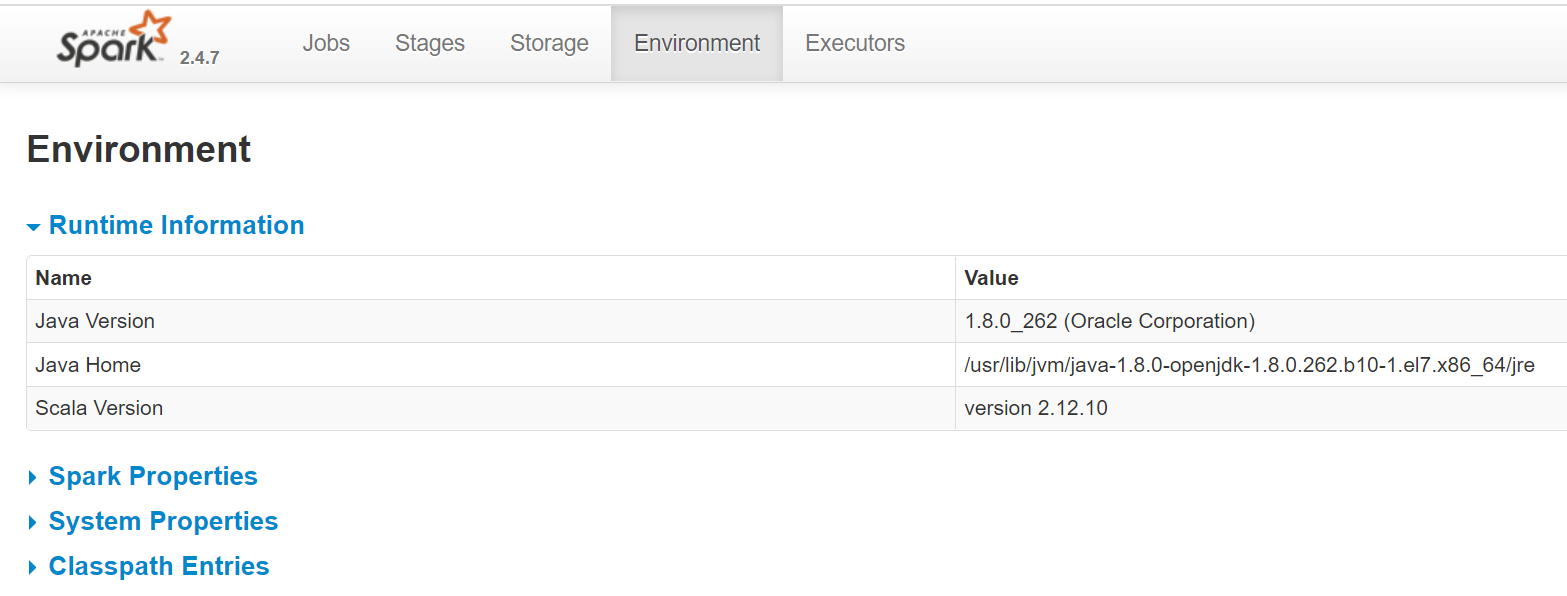
The pipeline UI URL opens the Spark UI in your browser as illustrated in the image below:
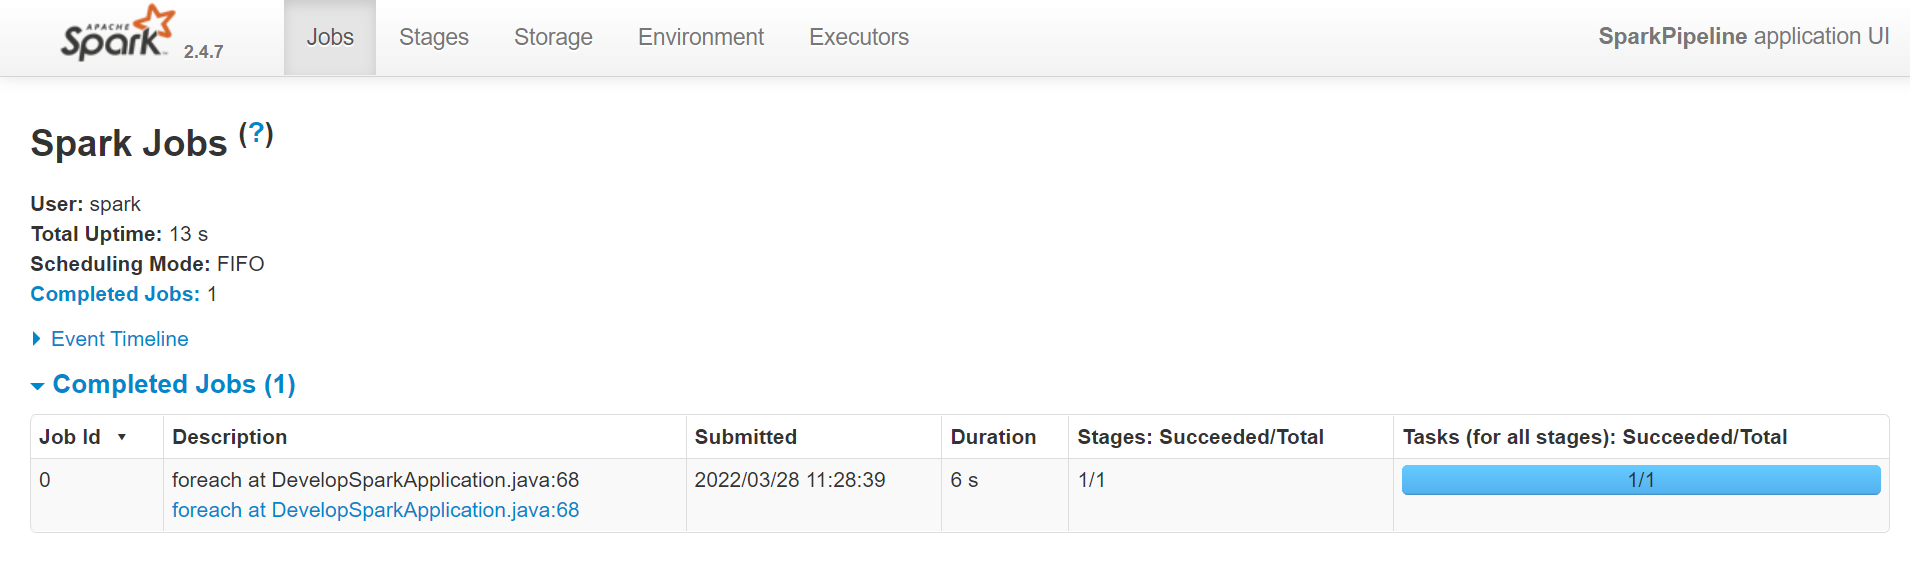
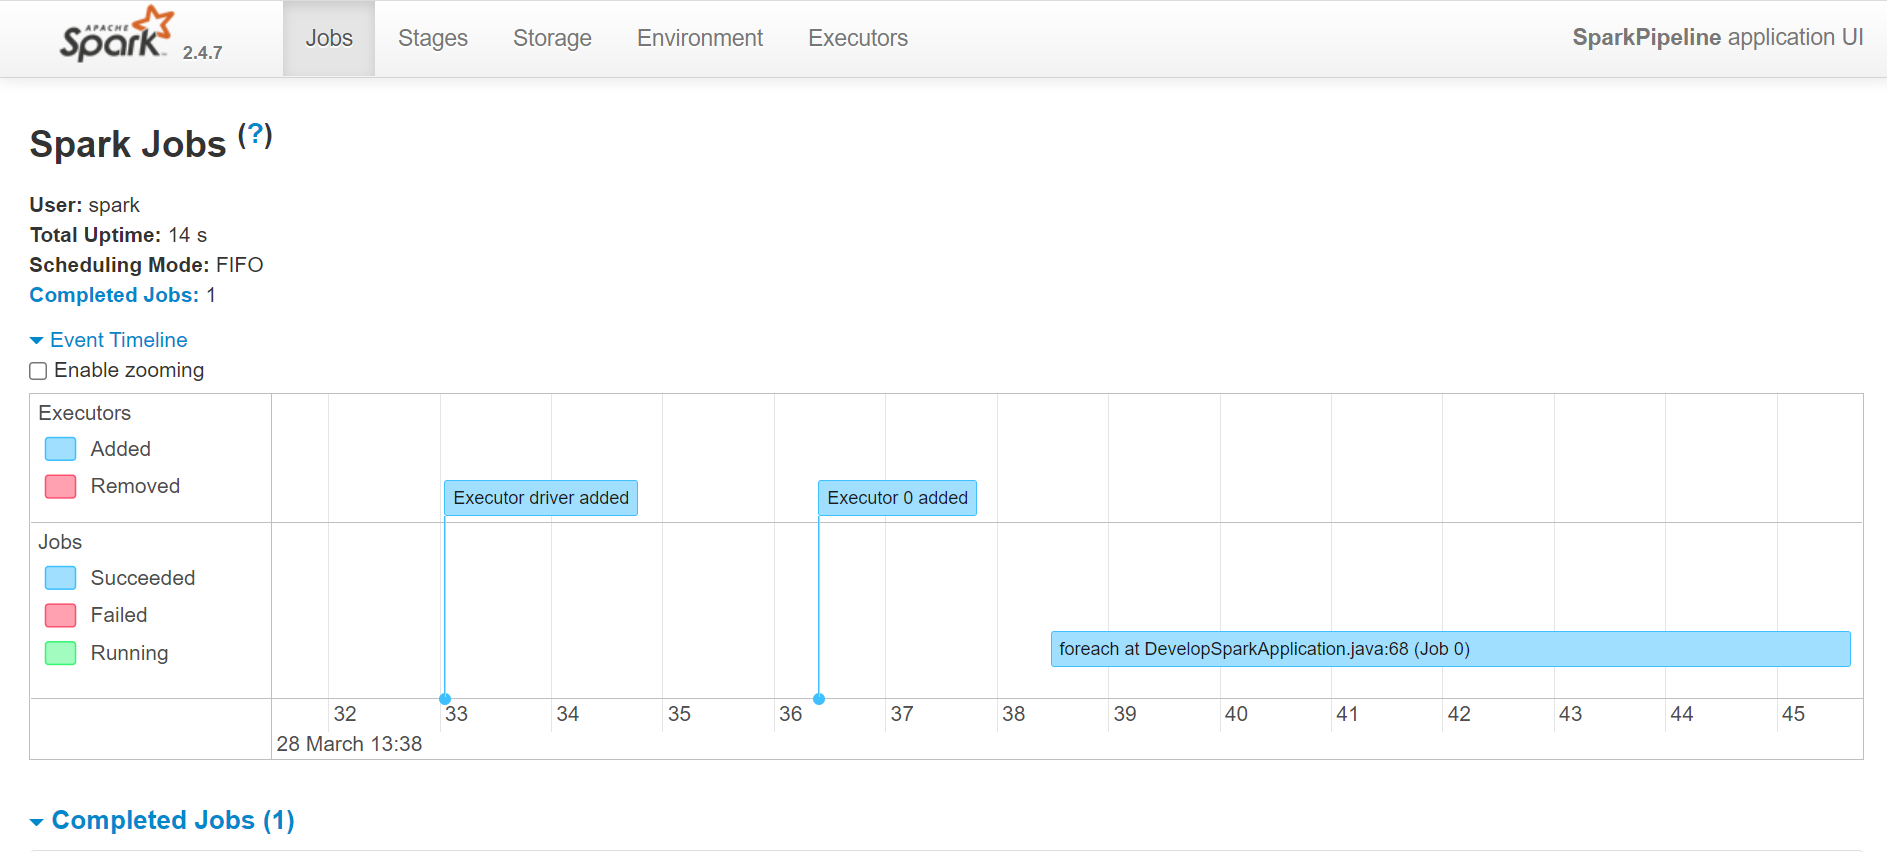
There are 5 tabs that allow access to different categories of information. The Jobs tab displays a summary page of all jobs in the Spark application and a details page for each job. The summary page shows high-level information, such as the status, duration, and progress of all jobs and the overall event timeline. When you click on a job on the summary page, you see the details page for that job.
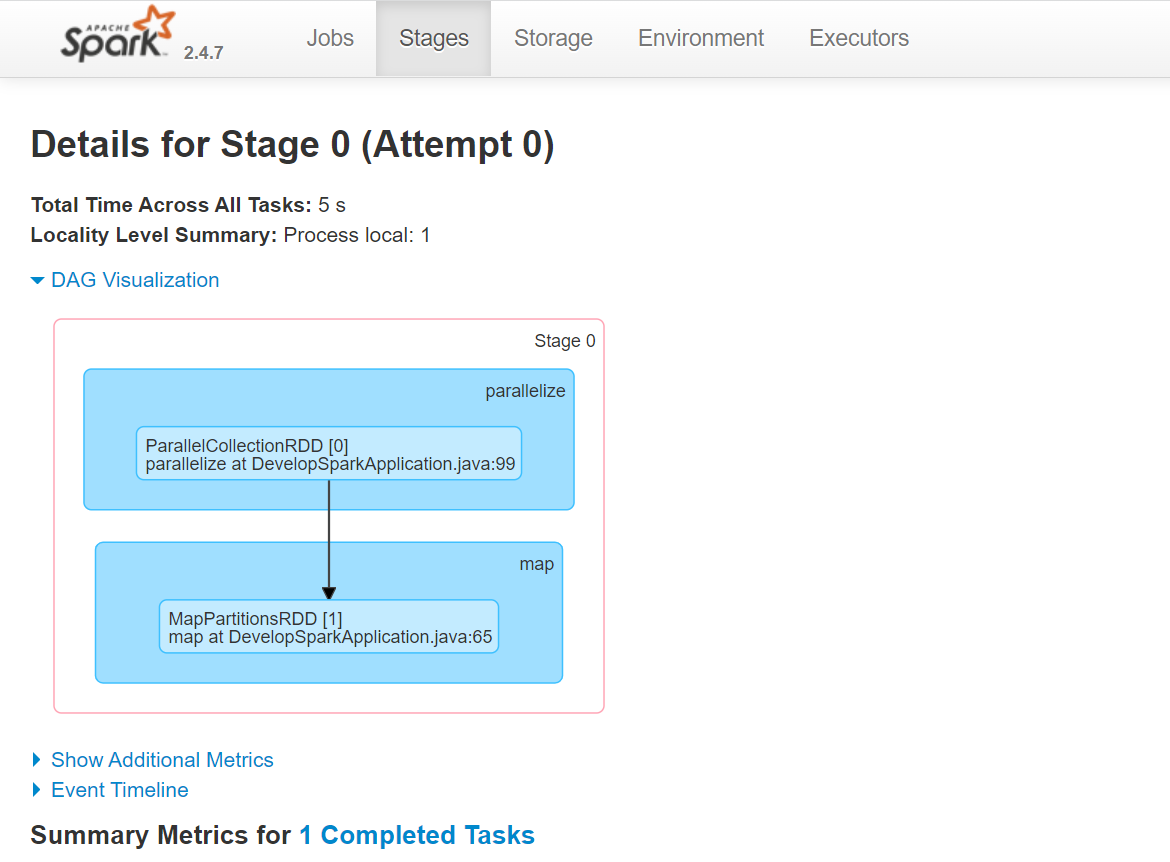
The Stages tab displays a summary page that shows the current state of all stages of all jobs in the Spark application.
The Storage tab displays the persisted RDDs and DataFrames, if any, in the application. The summary page shows the storage levels, sizes and partitions of all RDDs, and the details page shows the sizes and using executors for all partitions in an RDD or DataFrame.
The Environment tab displays the values of different environment and configuration variables, including JVM, Spark, and system properties.
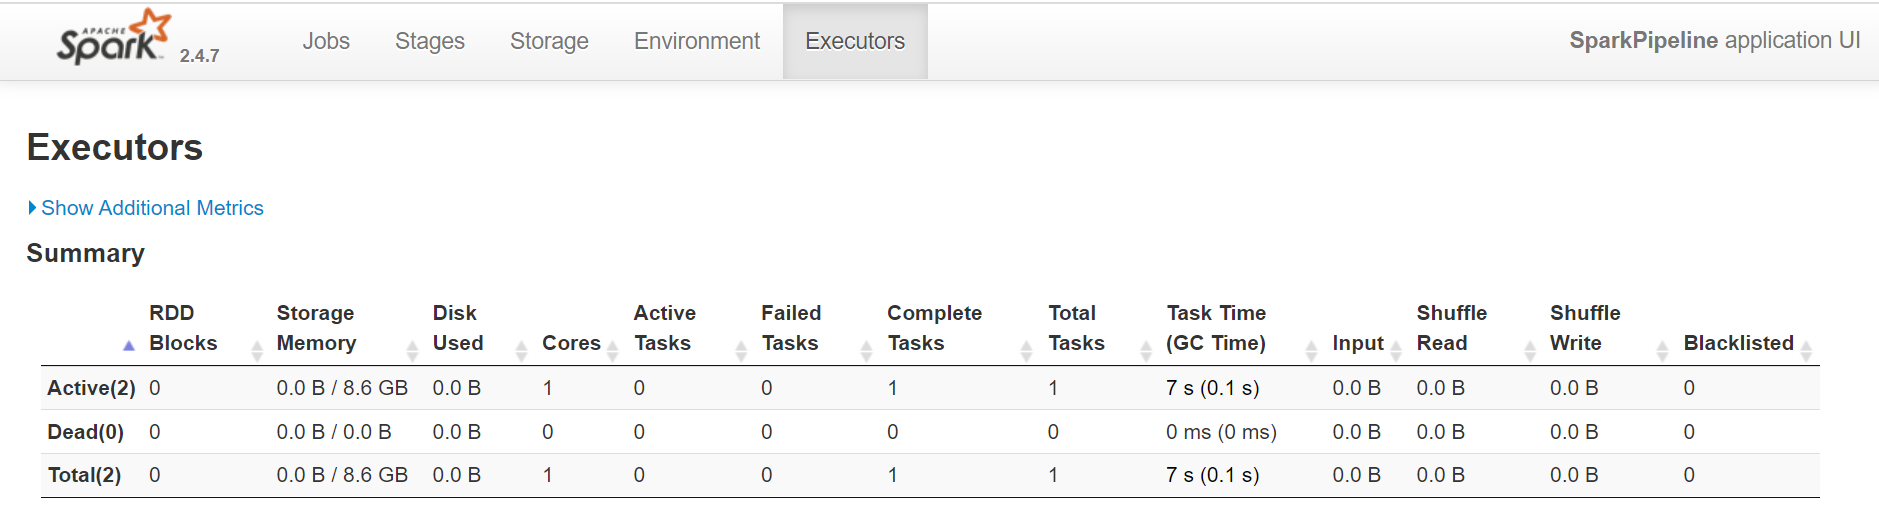
The Executors tab displays summary information about the executors that were created for the application, including memory and disk usage and task and shuffle information. The Storage Memory column shows the amount of memory used and reserved for caching data.
This version of the Spark UI has been modified to make it compatible with the platform. This means that there are some functions that might be available in a native Spark environment that are not available here. When browsing other Spark UI documentation, you may see discussions of features that are missing here. Those missing features are not compatible with the platform.
For information about Apache Spark Web UI, see Apache Spark Web UI page on the Apache Spark website.
Get application logs from Splunk
Splunk is a software platform to search, analyze and visualize machine-generated data gathered from the websites, applications, sensors, devices, and other sources, which make up your IT infrastructure and business. For information on how to use Splunk, see the Splunk Enterprise User Documentation.
On the HERE platform, the Logging Level is set for a Pipeline Version. All the Jobs use the Logging Level associated with the corresponding Pipeline Version. Logging Levels can be set at the root level for the entire pipeline and/or as an individual logging level for a specified class. By default, error and warn log entries are sent to Splunk for review. How much information is reported in the logs depends on the Logging Level you select for each pipeline version when it is executed. Due to operational latency, it takes a few minutes for the changes to take effect. This may delay the availability of the logs at the new level in Splunk.
To check the current Logging Level of your pipeline version, run the following OLP CLI command:
olp pipeline version log level get {{YOUR_PIPELINE_ID}} {{YOUR_PIPELINE_VERSION_ID}} --scope {{YOUR_PROJECT_HRN}}
The OLP CLI should return the following message:
Current logging configuration
root         warn
From the output, you can see that the default Logging Level is warn. This means that the Splunk will not display logs from our application because we log all the data using the Logger.info() method from the log4j library. In order for the Splunk to display our logs, it is necessary to set the Logging Level to info.
The OLP CLI provides the olp pipeline version log level set command to set up logging for the pipeline version:
olp pipeline version log level set {{YOUR_PIPELINE_ID}} {{YOUR_PIPELINE_VERSION_ID}} --root info --scope {{YOUR_PROJECT_HRN}}
The OLP CLI should return the following message:
Current logging configuration
root      info
For more information on how to configure logging in your application, see the Pipelines Developer Guide.
So far, the application has not sent any logs to Splunk. The application sends logs only when it processes data from the input catalog. Since we have a batch pipeline, this means that the started pipeline in the previous chapter has already been completed and moved to the Scheduled state. Therefore, we need to switch it to Running. To do this, make changes to the input catalog, and pipeline will be started according to the setting provided by the --schedule data-change parameter for activating the pipeline version. Let's put some data to the catalog using the following OLP CLI command:
olp catalog layer partition put {{YOUR_CATALOG_HRN}} versioned-layer-custom-data --partitions partition:data/partition_content --scope {{YOUR_PROJECT_HRN}}
The OLP CLI should return the following message:
 100% [======================================================] 1/1 (0:00:00 / 0:00:00)

Partition partition was successfully uploaded.
Once the input catalog has been changed, the pipeline switches to the Running state and processes data from the input catalog, or rather logs partition content to Splunk.
Use the logging URL from the pipeline version show command when the pipeline has changed to the Running state to reach the Splunk UI.
Each running Pipeline Version has a unique URL where the logs for that pipeline are stored. When using the CLI, the log URL information is supplied by the pipeline whenever a pipeline version activate, pipeline version upgrade, pipeline version show command is executed.
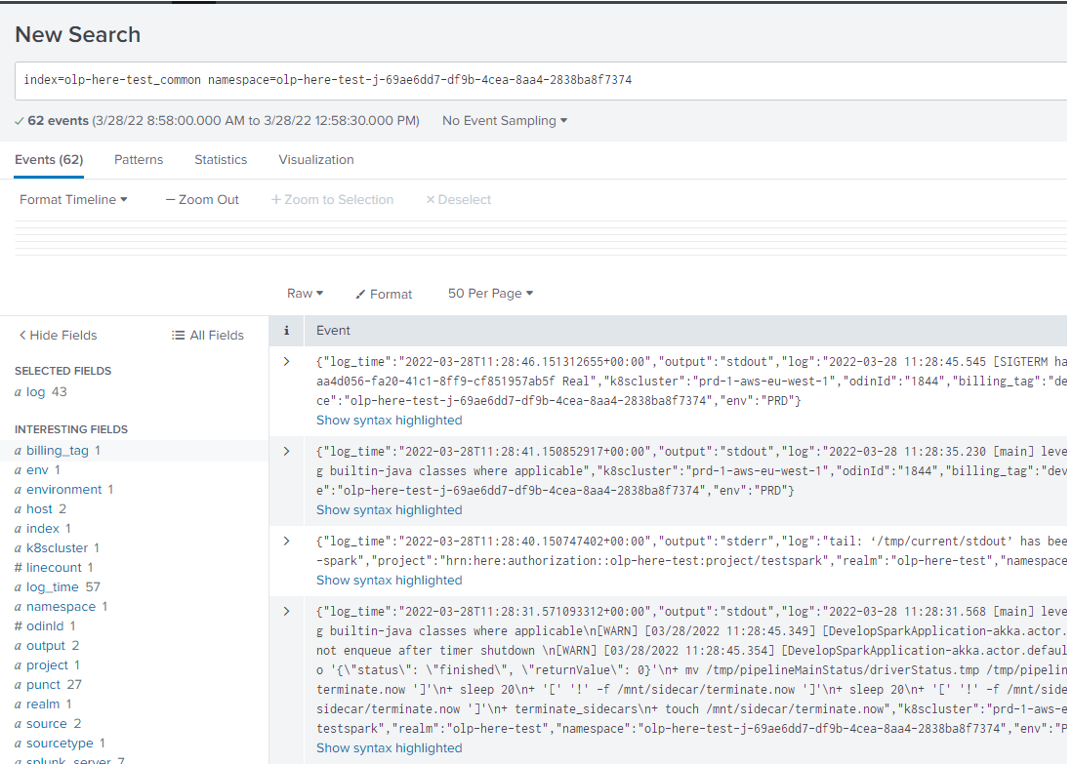
If you need to find some specific logs in Splunk, you can add a filter as the last parameter in the Search line. Pipeline logs are stored in the <realm>_common index. For example, if your account is in the olp-here realm, your index would be olp-here_common.
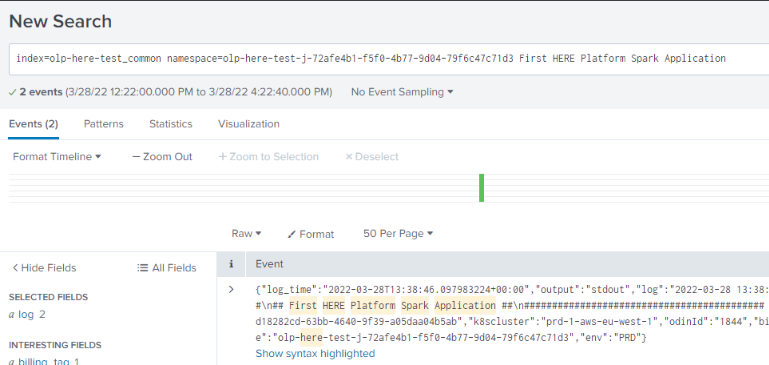
From the image below, you can see that the Search line contains the index, the namespace generated by the pipeline version, and the last First HERE Platform Spark Application parameter, which is just a filter by which we want to find data uploaded to the catalog before.
For more information on how to get logs from Splunk, see the Search Application Logs page.
This way, you can set up logging for your application to get information that it produces using the Splunk UI.
Monitor application data using Grafana Dashboard
Now that the application has run on the platform and you have verified that it is working correctly with Spark UI and Splunk, the next step is to set up monitoring.
Grafana is a complete observability stack that allows you to monitor and analyze metrics, logs, and traces. It allows you to query, visualize, alert on, and understand your data, no matter where it is stored.
There is one Grafana per the region. Metrics displayed on dashboards will belong only to that region. That's why the platform provides Primary and Secondary Regions Monitoring pages.
This tutorial runs on the Primary region and shows the instructions for Primary Region Grafana only.
This tutorial demonstrates how to monitor your application execution, or rather check the pipeline status using the existing Grafana Dashboard, create your own Grafana Dashboard that monitors the count of the failed jobs and Grafana alert which sends an alert to you by email whenever a job fails.
To monitor the status of a pipeline, a Pipeline Status dashboard is available in Grafana.
Go to the platform portal, open the Launcher menu and select Primary Region Monitoring . This takes you to the Grafana home page.
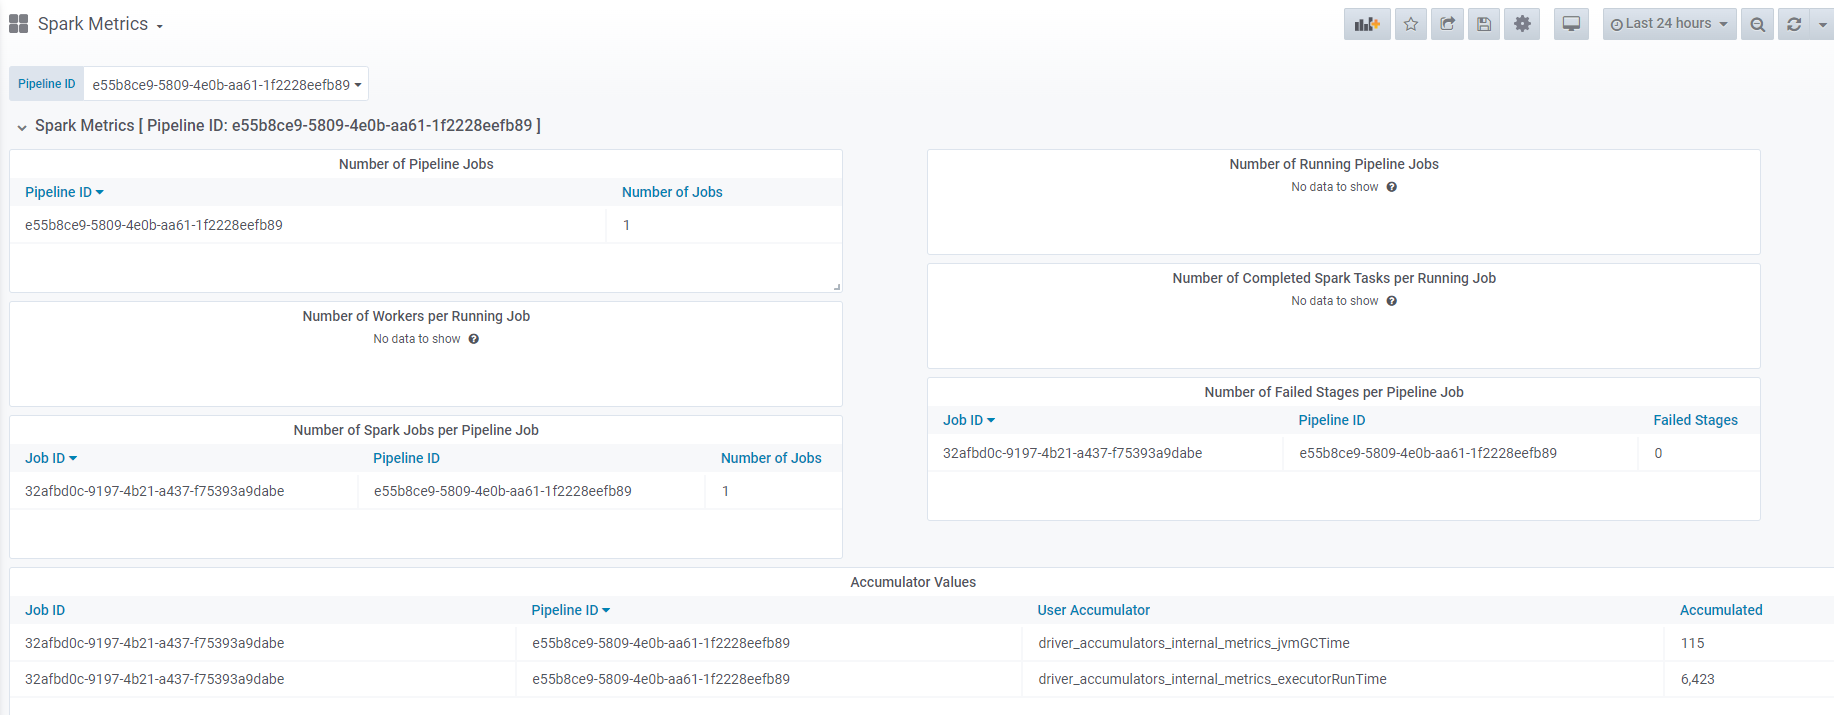
The home page allows access to several dashboards. Several Default Dashboards are listed on the left side of the page. From the list of default dashboards, locate the Spark Metrics dashboard. Click on the dashboard name to open it. The Spark Metrics dashboard shows Spark metrics related to your pipeline in the tabular view. To get information about your pipeline, enter your pipeline ID in the Pipeline ID field and press Enter.
As a result, you get all the available information about your pipeline, namely, number of pipeline jobs, number of running pipeline jobs, number of workers per running job, number of completed Spark tasks per running job, number of Spark jobs per pipeline job, and number of failed stages per pipeline job.
The platform allows not only to use the existing Grafana dashboards but also to create your own.
Note
If you want to create your own Grafana Dashboard and configure some specific metric query, you need to have the Dashboards monitor role. This role can be granted by any user that has the OrgAdmin role on the platform.
To create your own Grafana Dashboard, follow the steps below:
- Click
Create>Dashboard - Select
Add Queryand configure you query. - Add the
{__name__="pipeline_jobs_failed", pipelineId="YOUR_PIPELINE_ID"}query to monitor the count of the failed jobs. In the query above, the__name__parameter is set topipeline_jobs_failed. It means that the Grafana Dashboard will show the total number of failed jobs for the pipeline specified in thepipelineIdfield.
After the dashboard is created, it shows one job with zero value, because there were no failed jobs yet.

Let's add changes to the input catalog so that the pipeline gets into the Running state.
Just as we created a Grafana Dashboard that shows the number of failed jobs in the pipeline, let's make a job in our pipeline fail. To do this, we need to add the data/fail_pipeline partition to the input catalog. The content of this partition is THROW_EXCEPTION and if you take a look into the main class from which we created pipeline template, you will be able to see the following code:
if (partitionContent.contains("THROW_EXCEPTION")) {
  throw new RuntimeException("About to throw an exception");
}
This means that when reading partitions, the application will throw a RuntimeException if the content of the partition is equal to THROW_EXCEPTION, which will make the pipeline fail. You will able to monitor it using the Grafana Dashboard created above.
Let's push the THROW_EXCEPTION partition to the versioned layer, using the following OLP CLI command:
olp catalog layer partition put {{YOUR_CATALOG_HRN}} versioned-layer-custom-data --partitions partition:data/fail_pipeline --scope {{YOUR_PROJECT_HRN}}
The OLP CLI should return the following message:
 100% [======================================================] 1/1 (0:00:00 / 0:00:00)

Partition partition was successfully uploaded.
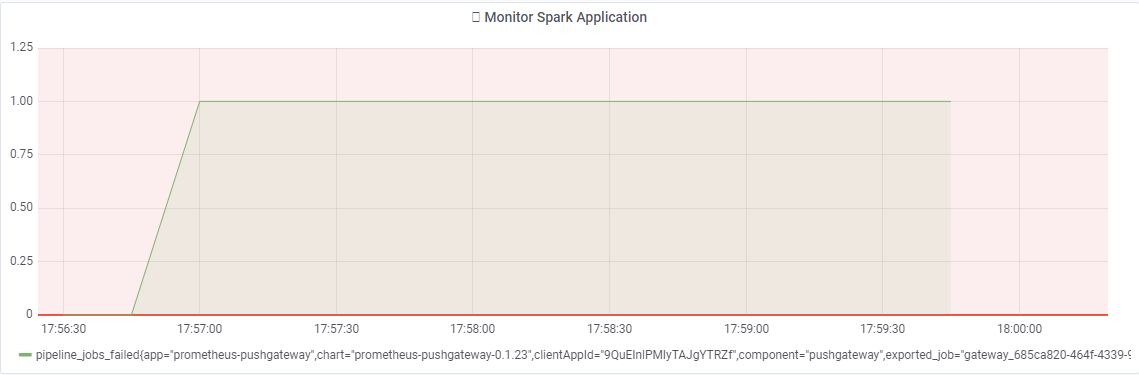
Once the partition has been uploaded to the versioned layer and pipeline has been triggered and then failed, you can see the results on the Grafana Dashboard created before.
In the image below, you can see that Grafana shows the failed pipeline.
For more information on how to configure Grafana queries to monitor Flink applications, see the Logs, Monitoring and Alerts User Guide.
The next step is to create an Alert to monitor that there are no failed jobs for the pipeline. Grafana lets you set up alerts and request email notifications when a condition or threshold is met.
First, you need to create a notification channel using the following steps:
- In Grafana, click the dropdown menu in the upper left, select
Alerting>Notification Channels>New channel. - Specify the channel name
Example Channel, selectemailin the type field and specify your email addressesemail@example.comin theEmail settingschapter:

For more details and options, see the Grafana Documentation on Notifications .
To create an alert, follow the steps below:
- Edit the Grafana Dashboard created as described above by clicking on the
Panel Titleand choosingEdit. - Select the
Alerttab to add values to the alert. - Specify the rule name in the
Namefield. In the example, theNameisSpark application alert. - Specify the frequency with which the rules should be checked in the
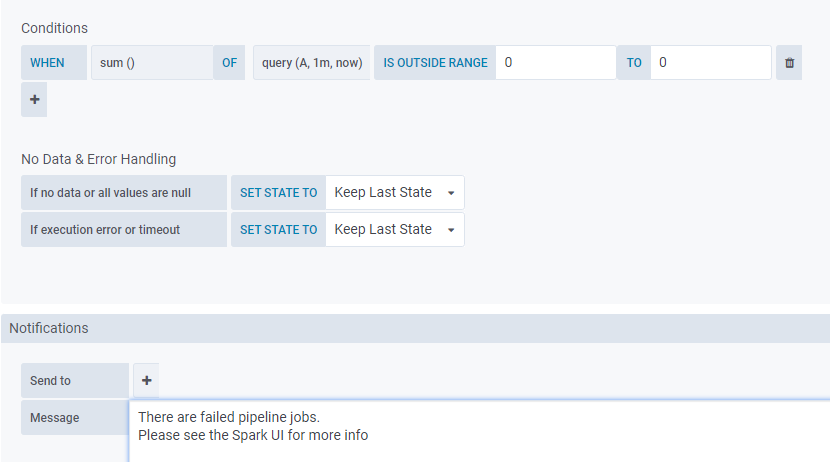
Evaluate every:1mandFor:1minutes. - Specify the conditions according to which the rules will be checked in the
Conditionschapter. In the example, theconditionisWHEN sum() OF query(A, 1m,now) IS OUTSIDE RANGE 0 TO 0. This condition means that if the result sum of the query on theAboard in the range of each minute is not equal 0, you will receive an alert.
For more information about conditions, see the Grafana Developer Guide. - Specify the previously created notification channel in the
Send totab and add the Message you want to send to the notification channel. In the example, the message isThere are failed pipeline jobs. Please see the Spark UI for more info.
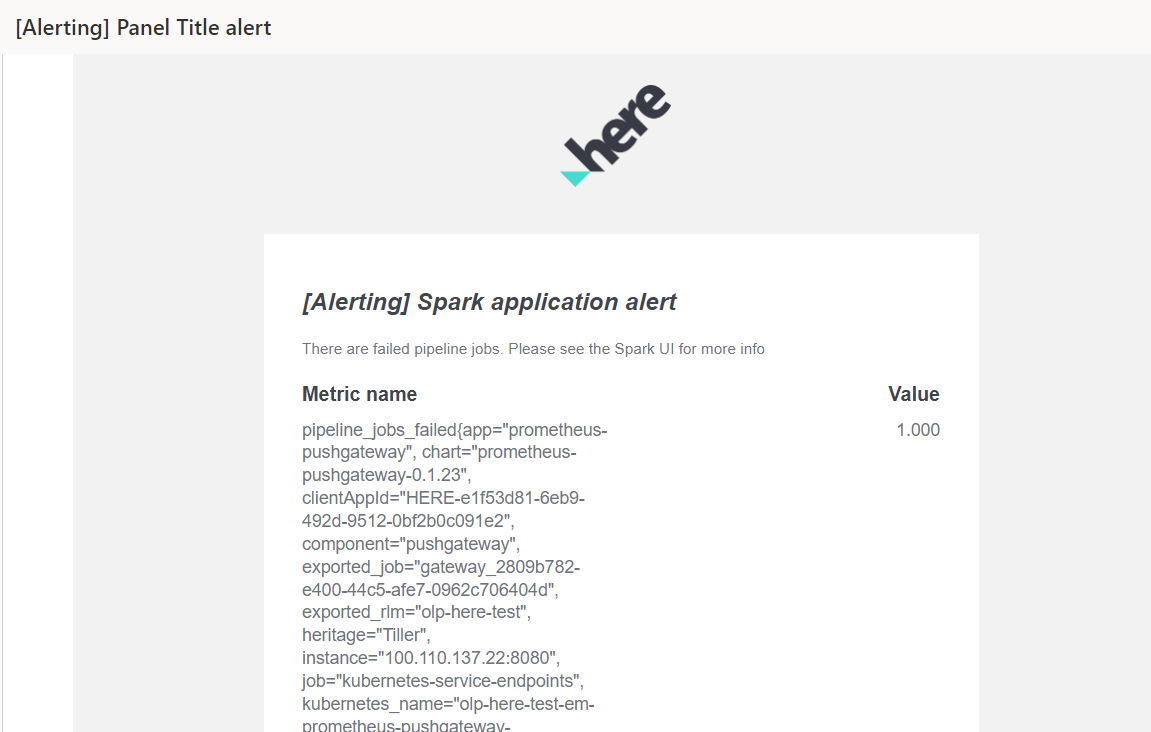
Once the Grafana Dashboard and Alerts are configured, upload the THROW_EXCEPTION partition to the versioned layer one more time to trigger pipeline run and check that Grafana alerts work and that you received an alert in the email.
A few minutes after the pipeline failed, you will receive an alert in the email with the message you specified when setting up the Alert.
Billing and usage
Organizations can manage their platform spending by obtaining organization, project, and/or app usage, and setting the usage limit at different dimensions. If you are building a stack of solutions on the platform, you may want to monitor your usage for selected services to better manage your spending. The HERE platform provides a set of cost management tools to assist with your cost management needs.
You can differentiate the costs in two ways:
- Using Project HRN, specifically, running the pipeline in the project scope as you do in this tutorial.
- Using billingTag, you can create a string that is used to combine expenses on your invoices. For example, you can group multiple pipelines together for a project or activity where you want to highlight those specific costs. To be able to obtain information about usage and billing using the billing tag, you need to create a pipeline version with the
--billing-tagparameter.
To check your billing and usage, perform the following steps:
- Open the Billing & usage tab in the platform.
- Select the time range and click Download .csv.
- Find your billing and usage by the project HRN or billing tag if you specified it when creating the pipeline version.
Note
Billing and usage data appear after 48 hours of running your application in the pipeline.
Information on which services were used during the program, how much data was used, and which items are billed is extracted from the CSV file to the table:
| Category | Service or Resource Name | Billing Tag | Project ID | Start Date | End Date | Usage Amount | Unit | Rate per Unit ($/EUR) | Total Price |
|---|---|---|---|---|---|---|---|---|---|
| Data | Metadata | project_hrn | 2022-03-15 | 2022-03-30 | 0.0000000053 | MB/s-months | 60 | - | |
| Data | Blob | project_hrn | 2022-03-15 | 2022-03-30 | 0.0000000106 | GB/s-months | 0.08 | 0 | |
| Data | Data IO | project_hrn | 2022-03-15 | 2022-03-30 | 0.0133039551 | GB | 0.3 | 0 | |
| Pipelines | Log Search IO | develop-spark | project_hrn | 2022-03-15 | 2022-03-30 | 0.1604950334 | GB | 3.5 | 0.56 |
| Pipelines | Pipeline IO | develop-spark | project_hrn | 2022-03-15 | 2022-03-30 | 0.0811133124 | GB | 0.13 | 0.01 |
The table shows the billing metrics for the project we have created. You can also see that the billing tag is associated only with the pipeline metrics as it has been set only for the pipeline version and not for the catalog.
The Data category billing metrics are connected to the usage of the catalog with versioned layer on the platform and the following services and resources used during the application execution:
-
Metadata- for the allocated storage used for metadata such as layer titles, coverage, tags, descriptions. Usage is measured as the maximum number of bytes of stored records per hour, and is calculated as the sum of data stored in indexes and persistent storage for metadata. -
Blob- for the allocated disk storage used to store blob data which is generated by versioned layers if message payloads exceed 1 Megabyte (MB) per month. -
Data IO- for transfer incurred when storing and accessing data in the HERE platform, both from within and from outside. Data IO is also incurred when ingesting data, publishing data and transferring data between the HERE platform components.
The Pipelines category billing metrics are connected to the running pipelines and the following services and resources were used during the application execution:
-
Log Search IO- for the data transfer incurred when pipeline generated log information is written and indexed for debugging purposes. -
Pipeline IO- for data transfer incurred when a Pipeline reads or writes data to or from the public Internet.
Another way to get a report on usage details is to indicate the project ID in the View dropdown on the Billing & usage page.
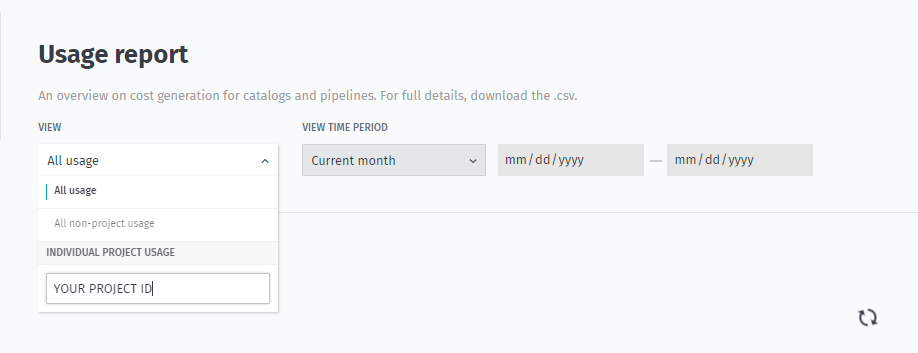
As a result, you will get aggregated usage details for your project in tabular form.
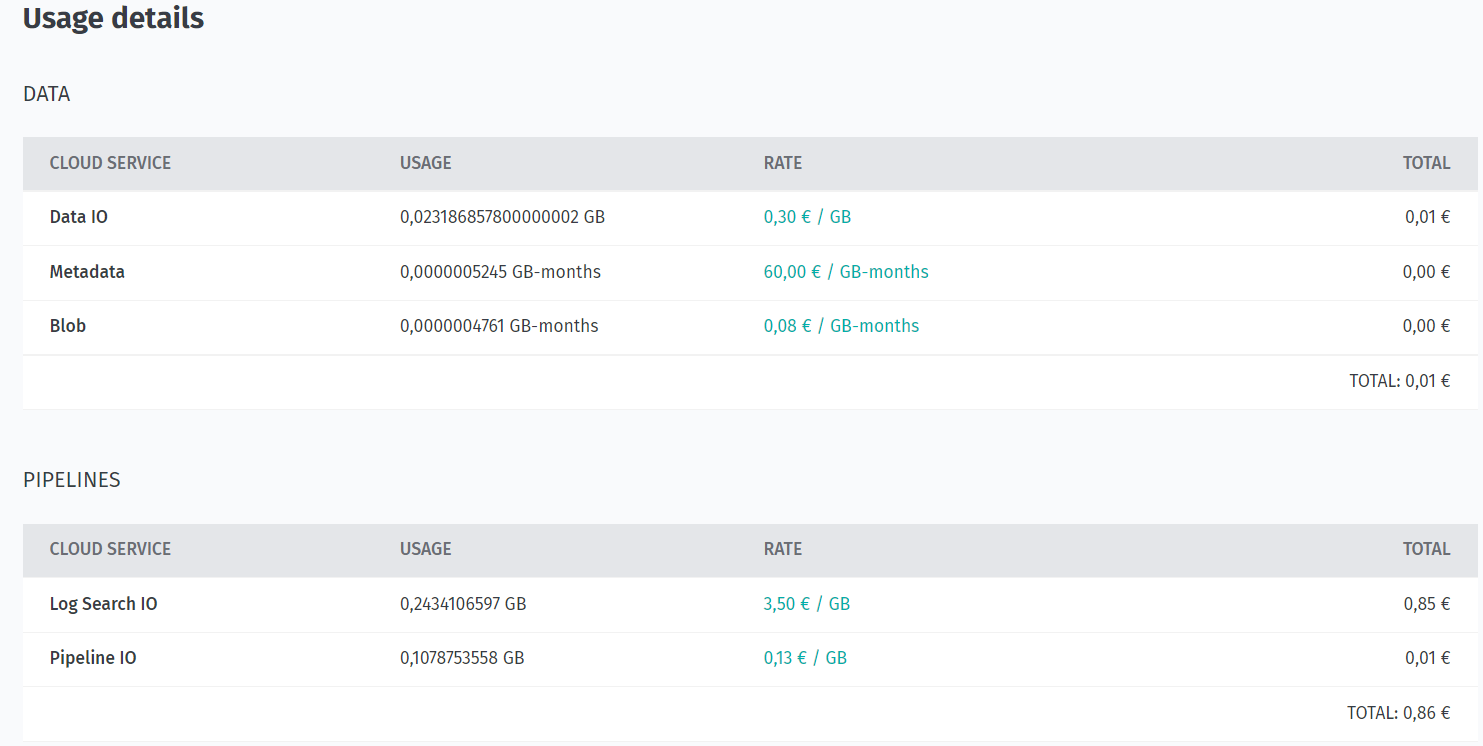
For the overview of cost concepts in the HERE platform, see the Billable services.
Conclusion
In this tutorial you have learned about the stages of development of the Spark program, learned to debug Spark applications, got acquainted with such monitoring tools as Splunk, Grafana, and Spark UI, and learned how to get Billing information on the platform.
Further information
For more details on the topics covered in this tutorial, see the following sources:
- For more information on how to develop Spark applications, see the Apache Spark Documentation.
- For more information on how to run an application on the pipeline, see the Pipelines Developer's Guide.
- For more information on how to run an application on the pipeline using the OLP CLI, see the OLP CLI Guide.
- For information on how to use Splunk, see the Splunk Enterprise User Documentation.
- For information about cost concepts, see the Billable services.