- Products ProductsLocation Services
Solve complex location problems from geofencing to custom routing
PlatformCloud environments for location-centric solution development, data exchange and visualization
Tracking & PositioningFast and accurate tracking and positioning of people and devices, indoors or outdoors
APIs & SDKsEasy to use, scaleable and flexible tools to get going quickly
Developer EcosystemsAccess Location Services on your favorite developer platform ecosystem
- Documentation DocumentationOverview OverviewServices ServicesApplications ApplicationsDevelopment Enablers Development EnablersContent ContentHERE Studio HERE StudioHERE Workspace HERE WorkspaceHERE Marketplace HERE MarketplacePlatform Foundation and Policy Documents Platform Foundation and Policy Documents
- Pricing
- Resources ResourcesTutorials TutorialsExamples ExamplesBlog & Release Announcements Blog & Release AnnouncementsChangelog ChangelogDeveloper Newsletter Developer NewsletterKnowledge Base Knowledge BaseFeature List Feature ListSupport Plans Support PlansSystem Status System StatusLocation Services Coverage Information Location Services Coverage InformationSample Map Data for Students Sample Map Data for Students
- Help
Clustering
Sometimes, you may need to display a large set of data on the map, for example several thousand points. There are two potential problems you may encounter: one is a possible performance degradation when all the points (markers) are visible at lower zoom levels, the other is the fact that the markers located in close geographic proximity to one another may visibly overlap and even hide one another at lower zoom levels. A solution to both these problems is offered by clustering.
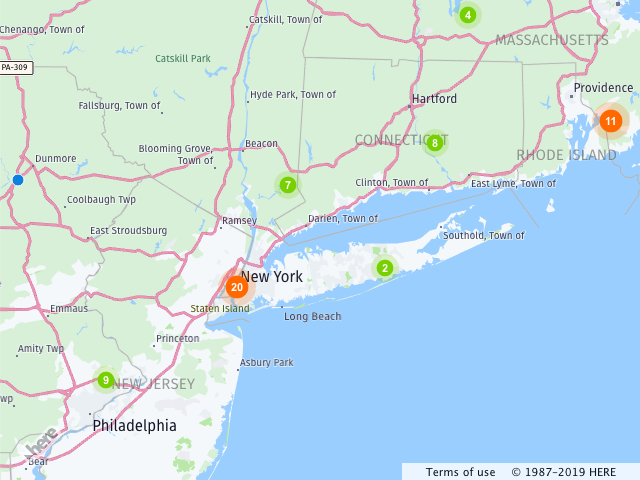
A clustering algorithm groups data points by collapsing two or more points positioned close to one another on the screen into a single cluster point. All other (not collapsed) points are still visible on map as noise points. The image below illustrates this. It shows the noise points as blue dots and clusters as green and orange markers, each showing the cumulative weight of the data points they combine.
Setting up Clustering
To be able to use clustering in the Maps API, the prerequisite is to include the clustering extension script in the <head> section of the HTML page:
<!DOCTYPE html>
  <html>
  <head>
  ...
  <meta name="viewport" content="initial-scale=1.0, width=device-width"/>
  <script src="https://js.api.here.com/v3/3.1/mapsjs-core.js"
     type="text/javascript" charset="utf-8"></script>
  <script src="https://js.api.here.com/v3/3.1/mapsjs-service.js"
     type="text/javascript" charset="utf-8"></script>
  <script src="https://js.api.here.com/v3/3.1/mapsjs-clustering.js"
     type="text/javascript" charset="utf-8"></script>
  ...
  </head>
Creating a Data Set
To show data as clusters on the map, prepare a data set and create a clustering provider that can support a map layer with clustered data. The data set is represented by an array of H.clustering.DataPoint objects as in example below.
var dataPoints = [];
dataPoints.push(new H.clustering.DataPoint(51.01, 0.01));
dataPoints.push(new H.clustering.DataPoint(50.04, 1.01));
dataPoints.push(new H.clustering.DataPoint(51.45, 1.01));
dataPoints.push(new H.clustering.DataPoint(51.01, 2.01));
Displaying Data on the Map
To display the newly created data set on the map:
- Create an
H.clustering.Providerobject that runs the clustering algorithm and groups data points, depending on their screen density - Use
H.map.layer.ObjectLayerto add the clustered objects on the map.
The code below implements both steps:
/**
 * Assuming that 'dataPoints' and 'map'
 * is initialized and available, create a data provider:
 */
var clusteredDataProvider = new H.clustering.Provider(dataPoints);

// Create a layer that includes the data provider and its data points:
var layer = new H.map.layer.ObjectLayer(clusteredDataProvider);

// Add the layer to the map:
map.addLayer(layer);
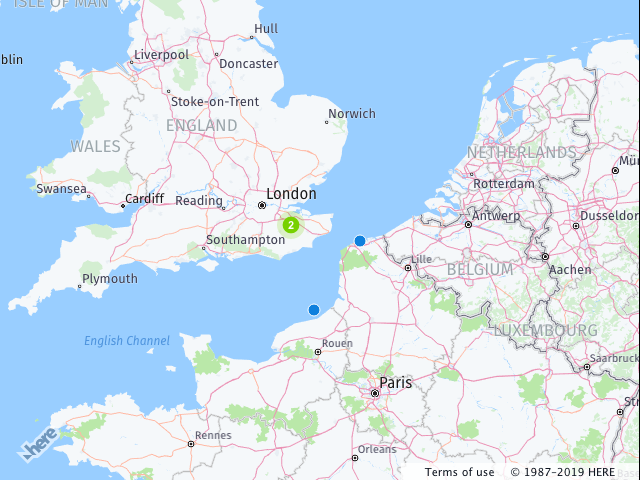
When executed, this code produces the effect shown in the map image below: a green marker indicating a cluster that combines two data points is placed south east of London and two blue noise points can be seen close to the southern side of the English Channel.
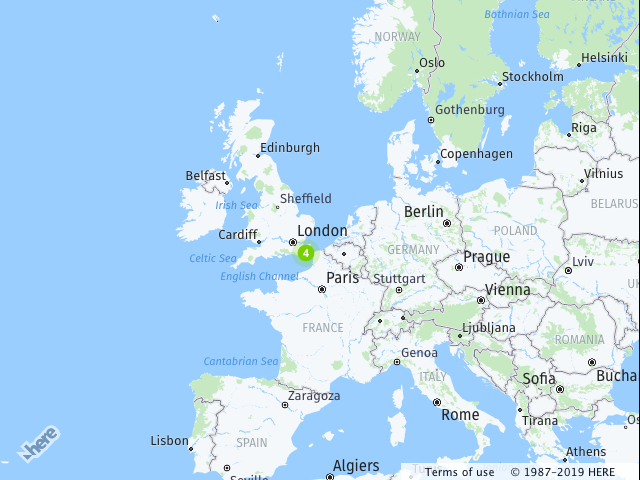
Zooming out causes all the data points to collapse into the single cluster point:
The configurable options on H.clustering.Provider allow you to fine-tune cluster creation. The class contains properties that determine the visual representation of clusters and noise points, the maximum radius within which data points are considered as part of a cluster and the minimum weight required to form a cluster.
The following example shows a cluster provider initialized with the parameters eps and minWeight. eps holds the value of the radius within which data points are considered for clustering, while minWeight holds the cumulative weight that points lying close to another must reach or exceed to be clustered. The value of minWeight is 3 in the example, which means that three points, each with the weight of one or two data points with the weight of 2 and 1, respectively, form a cluster.
var clusteredDataProvider = new H.clustering.Provider(dataPoints, {
  min: 4,
  max: 10,
  clusteringOptions: {
    eps: 32,
    minWeight: 3
  }
});
Theming
Clusters and noise points are represented on the map with markers. Unless otherwise configured, the clustering provider uses the default bitmap markers theme with weight information to display clusters and noise points on the map. You can define your own custom theme and pass it to the provider as the theme property. A custom theme is defined in an object that implements the interface H.clustering.ITheme as demonstrated by the code below.
// SVG template to use for noise icons
var noiseSvg = '<svg xmlns="http://www.w3.org/2000/svg" height="20px" width="20px"><circle cx="5px" cy="5px" r="5px" fill="green" /></svg>';

// Create an icon to represent the noise points
// Note that same icon will be used for all noise points
var noiseIcon = new H.map.Icon(noiseSvg, {
    size: { w: 20, h: 20 },
    anchor: { x: 10, y: 10},
  });

// SVG template to use for cluster icons
var clusterSvgTemplate = '<svg xmlns="http://www.w3.org/2000/svg" height="{diameter}" width="{diameter}">' +
    '<circle cx="{radius}px" cy="{radius}px" r="{radius}px" fill="red" />' +
    '</svg>';

// Create a clustered data provider and a theme implementation
var clusteredDataProvider = new H.clustering.Provider(dataPoints, {
    theme: {
      getClusterPresentation: function(cluster) {
        // Use cluster weight to change the icon size
        var weight = cluster.getWeight(),
          // Calculate circle size
          radius = weight * 5,
          diameter = radius * 2,

          // Replace variables in the icon template
          svgString = clusterSvgTemplate.replace(/\{radius\}/g, radius).replace(/\{diameter\}/g, diameter);

          // Create an icon
          // Note that we create a different icon depending from the weight of the cluster
          clusterIcon = new H.map.Icon(svgString, {
            size: {w: diameter, h: diameter},
            anchor: {x: radius, y: radius}
          }),

          // Create a marker for the cluster
          clusterMarker = new H.map.Marker(cluster.getPosition(), {
            icon: clusterIcon,

            // Set min/max zoom with values from the cluster, otherwise
            // clusters will be shown at all zoom levels
            min: cluster.getMinZoom(),
            max: cluster.getMaxZoom()
          });

        // Bind cluster data to the marker
        clusterMarker.setData(cluster);

        return clusterMarker;
      },
    getNoisePresentation: function(noisePoint) {
      // Create a marker for noise points:
      var noiseMarker = new H.map.Marker(noisePoint.getPosition(), {
            icon: noiseIcon,

            // Use min zoom from a noise point to show it correctly at certain zoom levels
            min: noisePoint.getMinZoom()
          });

      // Bind noise point data to the marker:
      noiseMarker.setData(noisePoint);
      return noiseMarker;
    }
  }
});
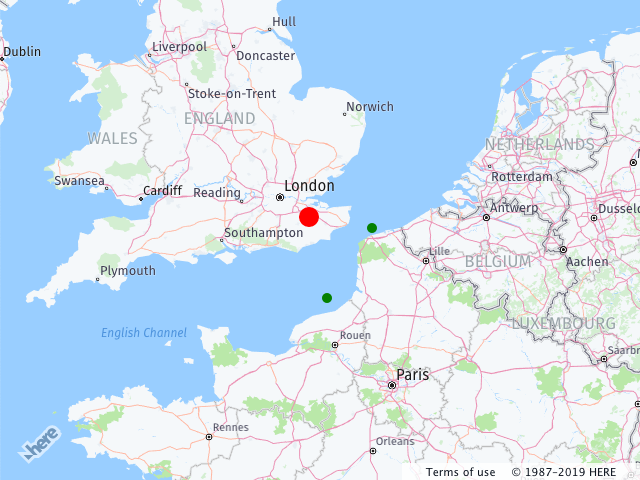
The result of providing a custom theme for four data points used in previous examples is shown in the following image, where cluster markers are red circles and noise points are green:
Interacting with markers
You can interact with markers representing clusters and noise points and access cluster (H.clustering.ICluster) or noise point (H.clustering.INoisePoint) data on demand by using map events. For that purpose, add an event listener for the event type you would like it to process to the clustering provider. In the following code, the listener is registered to handle tap events, and because it is added to the clustering provider, it receives only the tap events whose targets are the points in the provider's data set, including clusters. (The code assumes that the map has been initialized and that map events (see Map Events) are enabled).
var clusteredDataProvider = new H.clustering.Provider(dataPoints);
var layer = new H.map.layer.ObjectLayer(clusteredDataProvider);

map.addLayer(layer);

// Add an event listener to the Provider - this listener is called when a maker
// has been tapped:
clusteredDataProvider.addEventListener('tap', function(event) {
  // Log data bound to the marker that has been tapped:
  console.log(event.target.getData())
});