- Products ProductsLocation Services
Solve complex location problems from geofencing to custom routing
PlatformCloud environments for location-centric solution development, data exchange and visualization
Tracking & PositioningFast and accurate tracking and positioning of people and devices, indoors or outdoors
APIs & SDKsEasy to use, scaleable and flexible tools to get going quickly
Developer EcosystemsAccess Location Services on your favorite developer platform ecosystem
- Documentation DocumentationOverview OverviewServices ServicesApplications ApplicationsDevelopment Enablers Development EnablersContent ContentHERE Studio HERE StudioHERE Workspace HERE WorkspaceHERE Marketplace HERE MarketplacePlatform Foundation and Policy Documents Platform Foundation and Policy Documents
- Pricing
- Resources ResourcesTutorials TutorialsExamples ExamplesBlog & Release Announcements Blog & Release AnnouncementsChangelog ChangelogDeveloper Newsletter Developer NewsletterKnowledge Base Knowledge BaseFeature List Feature ListSupport Plans Support PlansSystem Status System StatusLocation Services Coverage Information Location Services Coverage InformationSample Map Data for Students Sample Map Data for Students
- Help
XYZ Spaces
Display an XYZ space on the Map
HERE XYZ is a real-time location data management service, with the set of XYZ tools such as CLI and an XYZ Studio it is easy to upload and manage the geo spatial data. HERE Maps API for JavaScript provides a simple way to add the data presented as an XYZ space to the existing application. Also, HERE Maps API for JavaScript allows building a new application that uses HERE services, such as Routing, Geocoding, Fleet Telematics Advanced Data Sets and others, alongside with XYZ.
The code examples below assume that the developer is familiar with XYZ and the XYZ spaces were created by the developer. The following simple use case involves the two spaces: one contains the building footprints public data, and the second contains a developer defined data. When executed, the code performs the following actions:
- Gets an instance of the XYZ service and passes an XYZ access token to it.
- Creates one XYZ provider for each space and adds them as an
H.map.layer.TileLayer.
// provided that the platform and the map are instantiated.
const service = platform.getXYZService({
  token: <YOUR_XYZ_ACCESS_TOKEN>,
});

// create a provider for the public buildings data
const buildingsSpaceProvider = new H.service.xyz.Provider(service, <XYZ_SPACE_ID>, {
  'min': 14
});
const buildingsSpaceLayer = new H.map.layer.TileLayer(buildingsSpaceProvider);
// add a layer to the map
map.addLayer(buildingsSpaceLayer);

// create a provider for the custom user defined data
const customSpaceProvider = new H.service.xyz.Provider(service, <XYZ_SPACE_ID>);
const customSpaceLayer = new H.map.layer.TileLayer(customSpaceProvider);
// add a layer to the map
map.addLayer(customSpaceLayer);
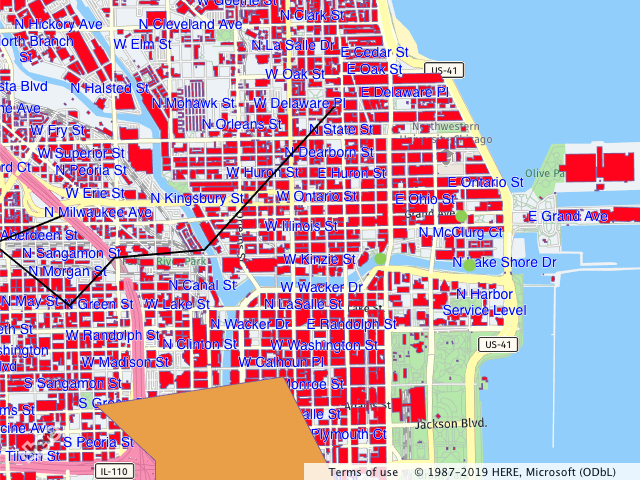
The example above uses the XYZ with the default style and settings, however, the API allows you to change the style of the layer and make it interactive. The code below extends the initial steps from the previous examples by:
- Changing the appearance (in this case a color) of the buildings layer.
- Making the buildings layer interactive and registering a tap event listener with the tile provider.
// get the style for the layer
var style = buildingsSpaceProvider.getStyle();

// change the color of the polygons
style.setProperty('layers.xyz.polygons.draw.polygons.color', 'red');

style.setInteractive(['xyz'], true);
buildingsSpaceProvider.addEventListener('tap', (evt) => {console.log(evt.target.getData())});

// make the objects within the provider interactive
style.setInteractive(['xyz'], true);

// add an event listener to the provider
// the event listener outputs into the console the data associated
// with the object
buildingsSpaceProvider.addEventListener('tap', (evt) => {
  console.log(evt.target.getData())
});
The listener is a callback function to be invoked when the map user taps on a map (spatial) object, for example a marker. It retrieves the object from the event passed to it and outputs information associated with the object to the console.
The image below shows the observable effects of this code on the map.
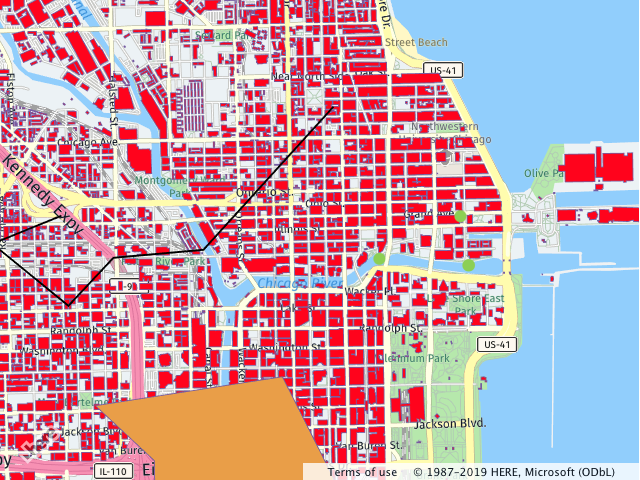
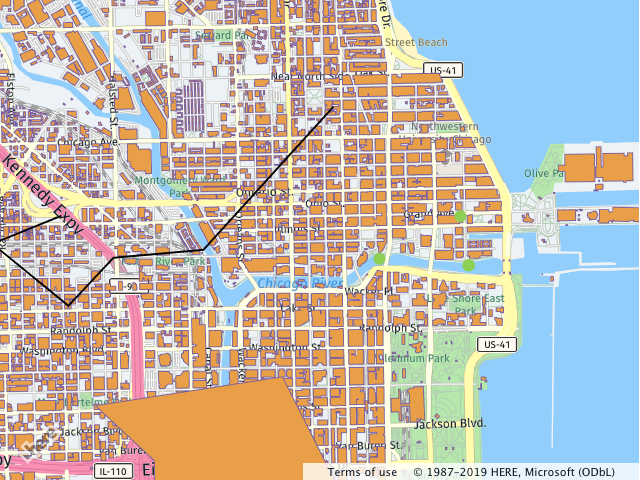
You can also render the labels associated with the geometries, provided that the data exists within the space. The following code, when applied to the snippets above, adds a configuration rule that enables the display of the labels:
// get the style for the layer
var style = buildingsSpaceProvider.getStyle();

// set the configuration for the label display
buildingsSpaceLayer.getProvider().getStyle().setProperty('layers.xyz.labels', {
  draw: {
    text: {
      text_source: 'properties.street',
      // collide: false,
      priority: 0,
      font: {
        size: '14px',
        fill: 'blue',
        stroke: {
          color: 'white',
          width: '1px'
        }
      }
    }
  }
});
Note
By default, labels are part of the global collision detection. It is possible to switch off this behaviour by using the collide property of the text style. For more information on the style configuration, see Vector.
The image below demonstrates the effect of the above mentioned configuration.