- Products ProductsLocation Services
Solve complex location problems from geofencing to custom routing
PlatformCloud environments for location-centric solution development, data exchange and visualization
Tracking & PositioningFast and accurate tracking and positioning of people and devices, indoors or outdoors
APIs & SDKsEasy to use, scaleable and flexible tools to get going quickly
Developer EcosystemsAccess Location Services on your favorite developer platform ecosystem
- Documentation DocumentationOverview OverviewServices ServicesApplications ApplicationsDevelopment Enablers Development EnablersContent ContentHERE Studio HERE StudioHERE Workspace HERE WorkspaceHERE Marketplace HERE MarketplacePlatform Foundation and Policy Documents Platform Foundation and Policy Documents
- Pricing
- Resources ResourcesTutorials TutorialsExamples ExamplesBlog & Release Announcements Blog & Release AnnouncementsChangelog ChangelogDeveloper Newsletter Developer NewsletterKnowledge Base Knowledge BaseFeature List Feature ListSupport Plans Support PlansSystem Status System StatusLocation Services Coverage Information Location Services Coverage InformationSample Map Data for Students Sample Map Data for Students
- Help
Geo Shapes
The HERE Maps API for JavaScript provides an easy means of highlighting and demarcating areas on the map with circles, rectangles, polylines and polygons (spatials for short). You can draw them on an on-line map just as you can on a paper one with a pencil or pen, but with much greater flexibility, because the API allows determining not only the shape, color(s), and line thickness for each shape, but also the transparency. More importantly, spatials allow positioning the shape with pinpoint geographic accuracy.
A polyline (H.map.Polyline) is a line on the map defined in terms of a set of points (represented in the API as a geo.LineString) and a style that defines the way the Maps API traces the line on the map. A polyline can be used for drawing paths similar to routes. A polygon (H.map.Polygon) is similar to a polyline, except it is a closed shape, therefore it can be used to show or highlight an area on the map. Unlike a polyline, a polygon is traced with an optional outline and can be filled with an arbitrary color.
Rectangles (H.map.Rect) and circles (H.map.Circle) are extensions of polygons.
To display a geo shape, you must instantiate the corresponding API class and add the resulting object to the Map object.
Adding a Circle to the Map
The example below demonstrates how to add a circle to the map.
    // Instantiate a map object:
var map = new H.Map(...);

// Instantiate a circle object (using the default style):
var circle = new H.map.Circle({lat: 52.51, lng: 13.4}, 8000);

// Add the circle to the map:
map.addObject(circle);
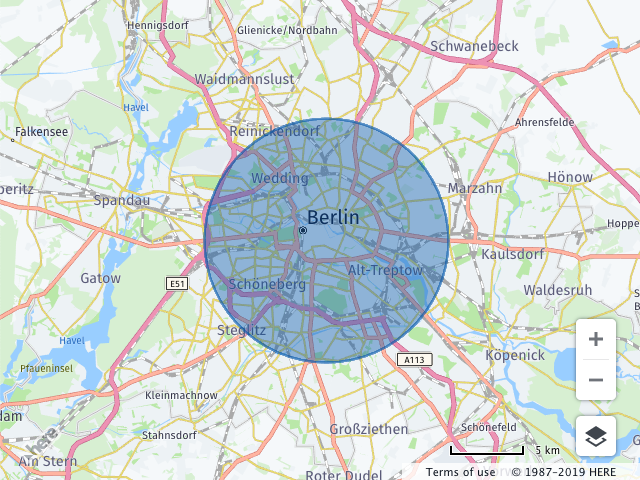
The code creates a map object (see also Get Started), instantiates a circle, providing the latitude and longitude of its center and the radius, and finally adds the circle to the map.
The image below shows the result.
Styling Geo Shapes
The Maps API allows customizing the visual appearance of geo shapes through styling. The customization options include:
| Style property | Description |
|---|---|
strokeColor | The color of a shapes outline |
lineWidth | The width of the outline in pixels |
fillColor | The color with which a shape's area will be filled (ignored for polylines) |
lineCap | The rendering style of outline endings |
lineJoin | The rendering style for vertices within the outline |
The following example shows how to apply custom styling to a rectangle object.
// Create a map object:
var map = new H.Map(...);

// Create a style object:
var customStyle = {
  strokeColor: 'black',
  fillColor: 'rgba(255, 255, 255, 0.5)',
  lineWidth: 10,
  lineCap: 'square',
  lineJoin: 'bevel'
};

// Create a rectangle and pass the custom style as an options parameter:
var rect = new H.map.Rect(new H.geo.Rect(53.5, 12.5, 51.5, 14.5),
  { style: customStyle });

// Add the rectangle to the map:
map.addObject(rect);

// Zoom the map to fit the rectangle:
map.getViewModel().setLookAtData({bounds: rect.getBoundingBox()});
When executed, the code creates:
- A map object (see also Get Started)
- An object holding the details of the styling such as the stroke and fill color and line properties
- An instance of a rectangle, specifying the geographic coordinates of its corners and providing the style object
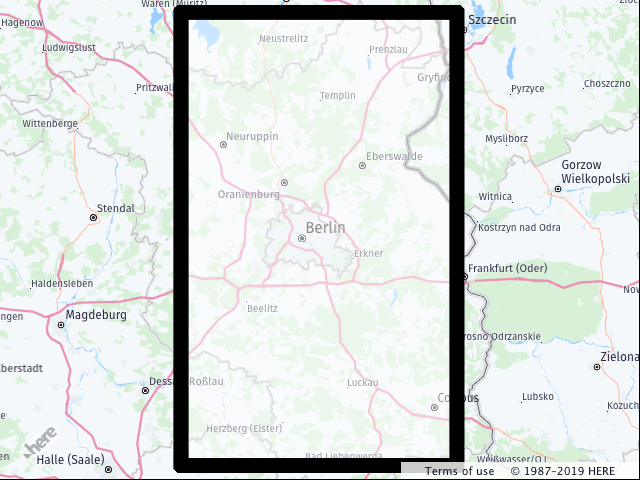
The last two function calls add the rectangle to the map and set the map view bounds to ensure that the entire rectangle is displayed.
The image below shows the resulting map view.
Shapes from Arbitrary Geographic Points
The above examples make use of pre-defined shapes to put a circle and a rectangle on the map, respectively. However, in most cases, map shapes are created from different arbitrary sources such as GPS traces or routing information.
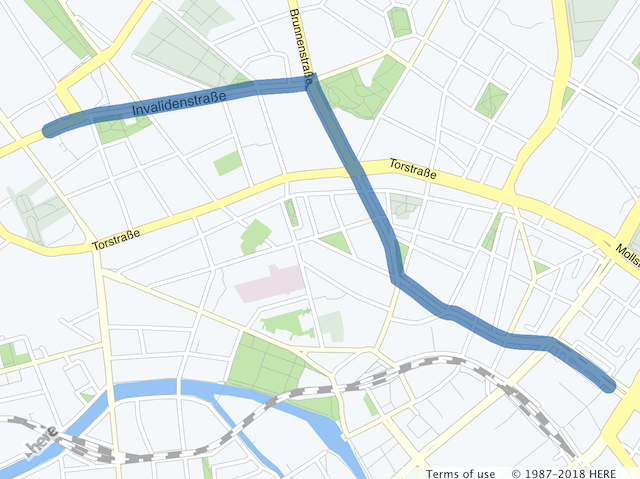
The following example converts arbitrary geographical points into a polyline. First, it creates a map object (see also Get Started), then an array of points defined by their latitude and longitude. In the next step, the code converts the points to a LineString object (H.geo.LineString) which represents an ordered set of points. This LineString instance is a point source for the polyline.
The example ends by adding the polyline to the map and setting the view bounds so that the entire shape is visible.
// Create a map object:
var map = new H.Map(...);

// Define points to represent the vertices of a short route in Berlin, Germany:
var points = [
  { lat: 52.5309825, lng: 13.3845921 },
  { lat: 52.5311923, lng: 13.3853495 },
  { lat: 52.5313532, lng: 13.3861756 },
  { lat: 52.5315142, lng: 13.3872163 },
  { lat: 52.5316215, lng: 13.3885574 },
  { lat: 52.5320399, lng: 13.3925807 },
  { lat: 52.5321472, lng: 13.3935785 },
  { lat: 52.5323832, lng: 13.395499  },
  { lat: 52.5324261, lng: 13.3959818 },
  { lat: 52.5325012, lng: 13.397795  },
  { lat: 52.5325656, lng: 13.3986318 },
  { lat: 52.5326192, lng: 13.3989215 },
  { lat: 52.5325119, lng: 13.3989751 },
  { lat: 52.5323081, lng: 13.3991039 },
  { lat: 52.5318789, lng: 13.3994472 },
  { lat: 52.5301194, lng: 13.4009278 },
  { lat: 52.5297546, lng: 13.4012604 },
  { lat: 52.5296152, lng: 13.4014106 },
  { lat: 52.5289822, lng: 13.4018934 },
  { lat: 52.5276947, lng: 13.4029663 },
  { lat: 52.5271797, lng: 13.4033203 },
  { lat: 52.5269973, lng: 13.4033954 },
  { lat: 52.5265145, lng: 13.4035349 },
  { lat: 52.5260746, lng: 13.4036851 },
  { lat: 52.5260103, lng: 13.4038353 },
  { lat: 52.5256562, lng: 13.40464   },
  { lat: 52.5253022, lng: 13.4053588 },
  { lat: 52.5250447, lng: 13.4059381 },
  { lat: 52.5249588, lng: 13.4062278 },
  { lat: 52.5249267, lng: 13.4064317 },
  { lat: 52.5249052, lng: 13.406775  },
  { lat: 52.5248623, lng: 13.4069574 },
  { lat: 52.5241864, lng: 13.4089208 },
  { lat: 52.5241327, lng: 13.4091246 },
  { lat: 52.5240898, lng: 13.409307  },
  { lat: 52.5240040, lng: 13.4096611 },
  { lat: 52.5239503, lng: 13.4101653 },
  { lat: 52.5239289, lng: 13.4110343 },
  { lat: 52.5238967, lng: 13.4117103 },
  { lat: 52.5238752, lng: 13.4120321 },
  { lat: 52.5236285, lng: 13.4126866 },
  { lat: 52.5231242, lng: 13.4139311 },
  { lat: 52.5227809, lng: 13.4146714 },
  { lat: 52.5224799, lng: 13.4152412 }
];

// Initialize a linestring and add all the points to it:
var linestring = new H.geo.LineString();
points.forEach(function(point) {
  linestring.pushPoint(point);
});

// Initialize a polyline with the linestring:
var polyline = new H.map.Polyline(linestring, { style: { lineWidth: 10 }});

// Add the polyline to the map:
map.addObject(polyline);

// Zoom the map to fit the rectangle:
map.getViewModel().setLookAtData({bounds: polyline.getBoundingBox()});
The following image shows a map with the polyline created by this code.